Oracle 2015 Annual Report Download - page 59
Download and view the complete annual report
Please find page 59 of the 2015 Oracle annual report below. You can navigate through the pages in the report by either clicking on the pages listed below, or by using the keyword search tool below to find specific information within the annual report.-
 1
1 -
2
-
3
-
4
-
5
-
6
-
7
-
8
-
9
-
10
-
11
-
12
-
13
-
14
-
15
-
16
-
17
-
18
-
19
-
20
-
21
-
22
-
23
-
24
-
25
-
26
-
27
-
28
-
29
-
30
-
31
-
32
-
33
-
34
-
35
-
36
-
37
-
38
-
39
-
40
-
41
-
42
-
43
-
44
-
45
-
46
-
47
-
48
-
 49
49 -
 50
50 -
 51
51 -
 52
52 -
 53
53 -
 54
54 -
 55
55 -
 56
56 -
 57
57 -
 58
58 -
 59
59 -
 60
60 -
 61
61 -
 62
62 -
 63
63 -
 64
64 -
 65
65 -
 66
66 -
 67
67 -
 68
68 -
 69
69 -
70
-
71
-
72
-
73
-
74
-
75
-
76
-
77
-
78
-
79
-
80
-
81
-
82
-
83
-
84
-
85
-
86
-
87
-
88
-
89
-
90
-
91
-
92
-
93
-
94
-
95
-
96
-
97
-
98
-
99
-
100
-
101
-
102
-
103
-
104
-
105
-
106
-
107
-
108
-
109
-
110
-
111
-
112
-
113
-
114
-
115
-
116
-
117
-
118
-
119
-
120
-
121
-
122
-
123
-
124
-
125
-
126
-
127
-
128
-
129
-
130
-
131
-
132
-
133
-
134
-
135
-
136
-
137
-
138
-
139
-
140
-
141
-
142
-
143
-
144
-
145
-
146
-
147
-
148
-
149
-
150
-
151
-
152
-
153
-
154
-
155
 |
 |

Table of Contents
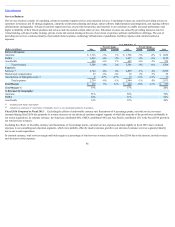
Excluding the effects of unfavorable foreign currency rate fluctuations, our total operating margin and total operating margin as a percentage of revenues decreased
in fiscal 2016 as our total expenses increased at a faster rate than our total revenues.
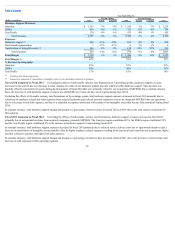
Fiscal 2015 Compared to Fiscal 2014: Our results of operations for fiscal 2015 compared to fiscal 2014 were significantly impacted by movements in
international currencies relative to the U.S. Dollar, which decreased our total revenues by 4 percentage points, total operating expenses by 3 percentage points and
total operating income by 6 percentage points.
Excluding the effects of unfavorable currency variations, our total revenues increased in fiscal 2015 due to revenue increases in our cloud and on-premise software
and hardware businesses. The constant currency growth in our cloud and on-premise software revenues was attributable to similar reasons as noted above. The
constant currency growth in our hardware business was attributable to growth in our hardware support revenues, which were primarily attributable to revenue
contributions from our acquisitions. Excluding the effects of currency rate fluctuations, the Americas region contributed 69%, the EMEA region contributed 28%
and the Asia Pacific region contributed 3% to the growth in our total revenues during fiscal 2015.
Excluding the effects of favorable currency variations, our total operating expenses increased during fiscal 2015 due to expense increases across all of our lines of
business, the largest of which were due to increased sales and marketing and research and development expenses resulting primarily from increased headcount,
increased cloud SaaS and PaaS expenses to support the increase in our cloud SaaS and PaaS revenues, and increased acquisition related and other expenses that was
primarily attributable to the goodwill impairment charge as noted above.
Excluding the effects of unfavorable foreign currency rate fluctuations, our fiscal 2015 operating margin was flat in comparison to the prior year, while our
operating margin as a percentage of revenues decreased in fiscal 2015 as our total operating expenses increased at a faster rate than our total revenues.
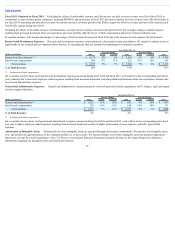
Supplemental Disclosure Related to Certain Charges
To supplement our consolidated financial information, we believe the following information is helpful to an overall understanding of our past financial
performance and prospects for the future. You should review the introduction under “Impact of Acquisitions” (above) for a discussion of the inherent limitations in
comparing pre- and post-acquisition information.
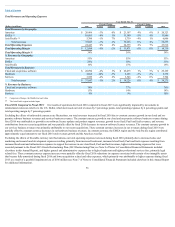
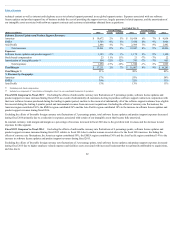
Our operating results included the following business combination accounting adjustments and expenses related to acquisitions, as well as certain other expense
and income items:
Year Ended May 31,
(in millions) 2016 2015 2014
Cloud software as a service and platform as a service deferred revenues $ 7 $ 12 $ 17
Software license updates and product support deferred revenues 2 11 3
Hardware support deferred revenues 1 4 11
Amortization of intangible assets 1,638 2,149 2,300
Acquisition related and other 42 211 41
Restructuring 458 207 183
Stock-based compensation 1,034 928 795
Income tax effects (846) (971) (1,091)
$ 2,336 $ 2,551 $ 2,259
In connection with our acquisitions, we have estimated the fair values of the cloud SaaS and PaaS subscriptions, software support and hardware support obligations assumed. Due to our application of
business combination accounting rules, we did not recognize the cloud SaaS and PaaS, software license updates and product support and hardware support revenue amounts as presented in the above table
that would have otherwise been recorded by the acquired businesses as independent entities upon delivery of the contractual obligations. To the extent customers to which these contractual obligations pertain
renew these contracts with us, we expect to recognize revenues for the full contracts’ values over the respective contracts’ renewal periods.
57
(1)
(1)
(1)
(2)
(3)(5)
(4)
(5)
(6)
(1)