Oracle 2015 Annual Report Download - page 110
Download and view the complete annual report
Please find page 110 of the 2015 Oracle annual report below. You can navigate through the pages in the report by either clicking on the pages listed below, or by using the keyword search tool below to find specific information within the annual report.-
 1
1 -
2
-
3
-
4
-
5
-
6
-
7
-
8
-
9
-
10
-
11
-
12
-
13
-
14
-
15
-
16
-
17
-
18
-
19
-
20
-
21
-
22
-
23
-
24
-
25
-
26
-
27
-
28
-
29
-
30
-
31
-
32
-
33
-
34
-
35
-
36
-
37
-
38
-
39
-
40
-
41
-
42
-
43
-
44
-
45
-
46
-
47
-
48
-
49
-
50
-
51
-
52
-
53
-
54
-
55
-
56
-
57
-
58
-
59
-
60
-
61
-
62
-
63
-
64
-
65
-
66
-
67
-
68
-
69
-
70
-
71
-
72
-
73
-
74
-
75
-
76
-
77
-
78
-
79
-
80
-
81
-
82
-
83
-
84
-
85
-
86
-
87
-
88
-
89
-
90
-
91
-
92
-
93
-
94
-
95
-
96
-
97
-
98
-
99
-
 100
100 -
 101
101 -
 102
102 -
 103
103 -
 104
104 -
 105
105 -
 106
106 -
 107
107 -
 108
108 -
 109
109 -
 110
110 -
 111
111 -
 112
112 -
 113
113 -
 114
114 -
 115
115 -
 116
116 -
 117
117 -
 118
118 -
 119
119 -
 120
120 -
121
-
122
-
123
-
124
-
125
-
126
-
127
-
128
-
129
-
130
-
131
-
132
-
133
-
134
-
135
-
136
-
137
-
138
-
139
-
140
-
141
-
142
-
143
-
144
-
145
-
146
-
147
-
148
-
149
-
150
-
151
-
152
-
153
-
154
-
155
 |
 |

Table of Contents
ORACLE CORPORATION
NOTES TO CONSOLIDATED FINANCIAL STATEMENTS—(Continued)
May 31, 2016
4. FAIR VALUE MEASUREMENTS
We perform fair value measurements in accordance with ASC 820. ASC 820 defines fair value as the price that would be received from selling an asset or paid to
transfer a liability in an orderly transaction between market participants at the measurement date. When determining the fair value measurements for assets and
liabilities required to be recorded at their fair values, we consider the principal or most advantageous market in which we would transact and consider assumptions
that market participants would use when pricing the assets or liabilities, such as inherent risk, transfer restrictions and risk of nonperformance.
ASC 820 establishes a fair value hierarchy that requires an entity to maximize the use of observable inputs and minimize the use of unobservable inputs when
measuring fair value. An asset’s or a liability’s categorization within the fair value hierarchy is based upon the lowest level of input that is significant to the fair
value measurement. ASC 820 establishes three levels of inputs that may be used to measure fair value:
• Level 1: quoted prices in active markets for identical assets or liabilities;
• Level 2: inputs other than Level 1 that are observable, either directly or indirectly, such as quoted prices in active markets for similar assets or liabilities,
quoted prices for identical or similar assets or liabilities in markets that are not active, or other inputs that are observable or can be corroborated by
observable market data for substantially the full term of the assets or liabilities; or
• Level 3: unobservable inputs that are supported by little or no market activity and that are significant to the fair values of the assets or liabilities.
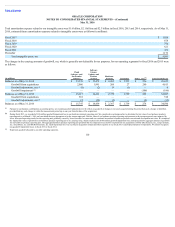
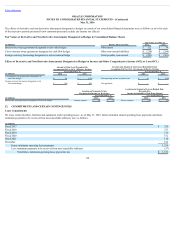
Assets and Liabilities Measured at Fair Value on a Recurring Basis
Our assets and liabilities measured at fair value on a recurring basis, excluding accrued interest components, consisted of the following (Level 1 and Level 2 inputs
are defined above):
May 31, 2016 May 31, 2015
Fair Value Measurements
Using Input Types
Fair Value Measurements
Using Input Types
(in millions) Level 1 Level 2 Total Level 1 Level 2 Total
Assets:
Money market funds $ 3,750 $ — $ 3,750 $ — $ — $ —
U.S. Treasury securities 214 — 214 668 — 668
Commercial paper debt securities — 2,155 2,155 — 9,203 9,203
Corporate debt securities and other 179 35,095 35,274 190 28,654 28,844
Derivative financial instruments — 122 122 — 74 74
Total assets $ 4,143 $ 37,372 $ 41,515 $ 858 $ 37,931 $ 38,789
Liabilities:
Derivative financial instruments $ — $ 218 $ 218 $ — $ 244 $ 244
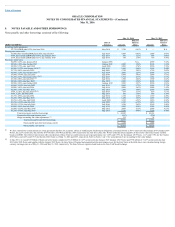
Our valuation techniques used to measure the fair values of our marketable securities that were classified as Level 1 in the table above were derived from quoted
market prices and active markets for these instruments exist. Our valuation techniques used to measure the fair values of Level 2 instruments listed in the table
above, the counterparties to which have high credit ratings, were derived from the following: non-binding market consensus prices that were corroborated by
observable market data, quoted market prices for similar instruments, or pricing models, such as discounted cash flow techniques, with all significant inputs derived
from or corroborated by observable market data including LIBOR-based yield curves, among others.
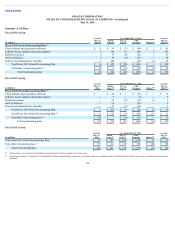
Based on the trading prices of our $40.1 billion and $42.0 billion of borrowings, which consisted of senior notes and the related fair value hedges that were
outstanding as of May 31, 2016 and 2015, respectively, the estimated
108