Oracle 2015 Annual Report Download - page 73
Download and view the complete annual report
Please find page 73 of the 2015 Oracle annual report below. You can navigate through the pages in the report by either clicking on the pages listed below, or by using the keyword search tool below to find specific information within the annual report.-
 1
1 -
2
-
3
-
4
-
5
-
6
-
7
-
8
-
9
-
10
-
11
-
12
-
13
-
14
-
15
-
16
-
17
-
18
-
19
-
20
-
21
-
22
-
23
-
24
-
25
-
26
-
27
-
28
-
29
-
30
-
31
-
32
-
33
-
34
-
35
-
36
-
37
-
38
-
39
-
40
-
41
-
42
-
43
-
44
-
45
-
46
-
47
-
48
-
49
-
50
-
51
-
52
-
53
-
54
-
55
-
56
-
57
-
58
-
59
-
60
-
61
-
62
-
 63
63 -
 64
64 -
 65
65 -
 66
66 -
 67
67 -
 68
68 -
 69
69 -
 70
70 -
 71
71 -
 72
72 -
 73
73 -
 74
74 -
 75
75 -
 76
76 -
 77
77 -
 78
78 -
 79
79 -
 80
80 -
 81
81 -
 82
82 -
 83
83 -
84
-
85
-
86
-
87
-
88
-
89
-
90
-
91
-
92
-
93
-
94
-
95
-
96
-
97
-
98
-
99
-
100
-
101
-
102
-
103
-
104
-
105
-
106
-
107
-
108
-
109
-
110
-
111
-
112
-
113
-
114
-
115
-
116
-
117
-
118
-
119
-
120
-
121
-
122
-
123
-
124
-
125
-
126
-
127
-
128
-
129
-
130
-
131
-
132
-
133
-
134
-
135
-
136
-
137
-
138
-
139
-
140
-
141
-
142
-
143
-
144
-
145
-
146
-
147
-
148
-
149
-
150
-
151
-
152
-
153
-
154
-
155
 |
 |

Table of Contents
Cash, cash equivalents and marketable securities: Cash and cash equivalents primarily consist of deposits held at major banks, Tier-1 commercial paper and
other securities with original maturities of 90 days or less. Marketable securities consist of Tier-1 commercial paper debt securities, corporate debt securities and
certain other securities. The increase in cash, cash equivalents and marketable securities at May 31, 2016 in comparison to May 31, 2015 was primarily due to cash
inflows generated by our operations during fiscal 2016, $1.8 billion of net cash inflows from fiscal 2016 debt issuances, net of debt repayments, and cash inflows
from fiscal 2016 stock option exercises. These fiscal 2016 cash inflows were partially offset by fiscal 2016 cash outflows of $10.4 billion for repurchases of our
common stock, $2.5 billion for the fiscal 2016 payment of cash dividends to our stockholders, and $1.2 billion for fiscal 2016 capital expenditures. Cash, cash
equivalents and marketable securities included $48.2 billion held by our foreign subsidiaries as of May 31, 2016. We consider $42.6 billion of our undistributed
earnings as indefinitely reinvested in our foreign operations outside the United States. These undistributed earnings would be subject to U.S. income tax if
repatriated to the United States. Assuming a full utilization of the foreign tax credits, the potential deferred tax liability associated with these undistributed earnings
would be approximately $13.3 billion as of May 31, 2016 should the amounts be repatriated to the United States. The amount of cash, cash equivalents and
marketable securities that we report in U.S. Dollars for a significant portion of the cash, cash equivalents and marketable securities balances held by our foreign
subsidiaries is subject to translation adjustments caused by changes in foreign currency exchange rates as of the end of each respective reporting period (the offset
to which is substantially recorded to accumulated other comprehensive loss in our consolidated balance sheets and is also presented as a line item in our
consolidated statements of comprehensive income included elsewhere in this Annual Report). As the U.S. Dollar generally strengthened against certain major
international currencies during fiscal 2016, the amount of cash, cash equivalents and marketable securities that we reported in U.S. Dollars for these subsidiaries
decreased on a net basis as of May 31, 2016 relative to what we would have reported using constant currency rates from our May 31, 2015 balance sheet date.
The increase in cash, cash equivalents and marketable securities at May 31, 2015 in comparison to May 31, 2014 was due to an increase in cash generated from our
fiscal 2015 operating activities, our issuance of $20.0 billion of senior notes in fiscal 2015, and to a lesser extent, cash proceeds from fiscal 2015 stock option
exercises. These fiscal 2015 cash inflows were partially offset by fiscal 2015 cash outflows of $6.2 billion of net cash paid for our acquisitions of MICROS and
others, $8.1 billion of fiscal 2015 repurchases of our common stock, the repayment of $1.5 billion of senior notes and $2.3 billion used for the payment of fiscal
2015 cash dividends to our stockholders. Additionally, our reported cash, cash equivalents and marketable securities balances as of May 31, 2015 decreased on a
net basis in comparison to May 31, 2014 as the U.S. Dollar generally strengthened in comparison to most major international currencies during fiscal 2015.
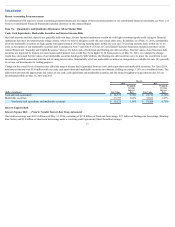
Days sales outstanding, which we calculate by dividing period end accounts receivable by average daily sales for the quarter, was 46 days at May 31, 2016
compared with 47 days at May 31, 2015. The days sales outstanding calculation excludes the impact of any revenue adjustments resulting from business
combinations that reduced our acquired cloud SaaS and PaaS obligations, software license updates and product support obligations and hardware support
obligations to fair value.
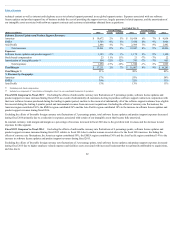
Year Ended May 31,
(Dollars in millions) 2016 Change 2015 Change 2014
Net cash provided by operating activities $ 13,561 -5% $ 14,336 -4% $ 14,921
Net cash used for investing activities $ (5,154) -73% $ (19,047) 153% $ (7,539)
Net cash (used for) provided by financing activities $ (9,856) 200% $ 9,850 342% $ (4,068)
Cash flows from operating activities: Our largest source of operating cash flows is cash collections from our customers following the purchase and renewal of
their software license updates and product support agreements. Payments from customers for these support agreements are generally received near the beginning of
the contracts’ terms, which are generally one year in length. Over the course of a fiscal year, we also have historically generated cash from the sales of new
software licenses, cloud SaaS and PaaS offerings, hardware products, hardware support arrangements, and services. Our primary uses of cash from operating
activities are for employee related expenditures, material and manufacturing costs related to the production of our hardware products, taxes and leased facilities.
71