Oracle 2015 Annual Report Download - page 109
Download and view the complete annual report
Please find page 109 of the 2015 Oracle annual report below. You can navigate through the pages in the report by either clicking on the pages listed below, or by using the keyword search tool below to find specific information within the annual report.-
 1
1 -
2
-
3
-
4
-
5
-
6
-
7
-
8
-
9
-
10
-
11
-
12
-
13
-
14
-
15
-
16
-
17
-
18
-
19
-
20
-
21
-
22
-
23
-
24
-
25
-
26
-
27
-
28
-
29
-
30
-
31
-
32
-
33
-
34
-
35
-
36
-
37
-
38
-
39
-
40
-
41
-
42
-
43
-
44
-
45
-
46
-
47
-
48
-
49
-
50
-
51
-
52
-
53
-
54
-
55
-
56
-
57
-
58
-
59
-
60
-
61
-
62
-
63
-
64
-
65
-
66
-
67
-
68
-
69
-
70
-
71
-
72
-
73
-
74
-
75
-
76
-
77
-
78
-
79
-
80
-
81
-
82
-
83
-
84
-
85
-
86
-
87
-
88
-
89
-
90
-
91
-
92
-
93
-
94
-
95
-
96
-
97
-
98
-
 99
99 -
 100
100 -
 101
101 -
 102
102 -
 103
103 -
 104
104 -
 105
105 -
 106
106 -
 107
107 -
 108
108 -
 109
109 -
 110
110 -
 111
111 -
 112
112 -
 113
113 -
 114
114 -
 115
115 -
 116
116 -
 117
117 -
 118
118 -
 119
119 -
120
-
121
-
122
-
123
-
124
-
125
-
126
-
127
-
128
-
129
-
130
-
131
-
132
-
133
-
134
-
135
-
136
-
137
-
138
-
139
-
140
-
141
-
142
-
143
-
144
-
145
-
146
-
147
-
148
-
149
-
150
-
151
-
152
-
153
-
154
-
155
 |
 |

Table of Contents
ORACLE CORPORATION
NOTES TO CONSOLIDATED FINANCIAL STATEMENTS—(Continued)
May 31, 2016
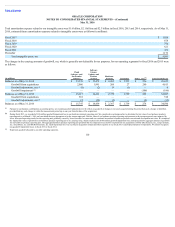
The unaudited pro forma financial information for fiscal 2016 combined the historical results of Oracle for fiscal 2016 and the historical results of certain other
companies that we acquired since the beginning of fiscal 2016 based upon their respective previous reporting periods and the dates these companies were acquired
by us, and the effects of the pro forma adjustments listed above.
The unaudited pro forma financial information for fiscal 2015 combined the historical results of Oracle for fiscal 2015, the historical results of MICROS for the six
months ended June 30, 2014 (adjusted due to differences in reporting periods and considering the date we acquired MICROS), and the historical results of certain
other companies that we acquired since the beginning of fiscal 2015 based upon their respective previous reporting periods and the dates these companies were
acquired by us, and the effects of the pro forma adjustments listed above. The unaudited pro forma financial information was as follows:
Year Ended May 31,
(in millions, except per share data) 2016 2015
Total revenues $ 37,084 $ 38,771
Net income $ 8,869 $ 9,844
Basic earnings per share $ 2.10 $ 2.24
Diluted earnings per share $ 2.06 $ 2.19
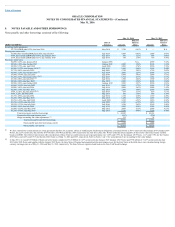
3. CASH, CASH EQUIVALENTS AND MARKETABLE SECURITIES
Cash and cash equivalents primarily consist of deposits held at major banks, Tier-1 commercial paper and other securities with original maturities of 90 days or
less. Marketable securities consist of Tier-1 commercial paper debt securities, corporate debt securities and certain other securities.
The amortized principal amounts of our cash, cash equivalents and marketable securities approximated their fair values at May 31, 2016 and 2015. We use the
specific identification method to determine any realized gains or losses from the sale of our marketable securities classified as available-for-sale. Such realized
gains and losses were insignificant for fiscal 2016, 2015 and 2014. The following table summarizes the components of our cash equivalents and marketable
securities held, substantially all of which were classified as available-for-sale:
May 31,
(in millions) 2016 2015
Money market funds $ 3,750 $ —
U.S. Treasury securities 214 668
Commercial paper debt securities 2,155 9,203
Corporate debt securities and other 35,274 28,844
Total investments $ 41,393 $ 38,715
Investments classified as cash equivalents $ 5,420 $ 6,063
Investments classified as marketable securities $ 35,973 $ 32,652
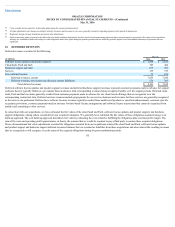
As of each of May 31, 2016 and 2015, approximately 28% of our marketable securities investments mature within one year and 72% mature within one to six
years. Our investment portfolio is subject to market risk due to changes in interest rates. As described above, we limit purchases of marketable debt securities to
investment-grade securities, which have high credit ratings and also limit the amount of credit exposure to any one issuer. As stated in our investment policy, we
are averse to principal loss and seek to preserve our invested funds by limiting default risk and market risk.
107