Oracle 2015 Annual Report Download - page 89
Download and view the complete annual report
Please find page 89 of the 2015 Oracle annual report below. You can navigate through the pages in the report by either clicking on the pages listed below, or by using the keyword search tool below to find specific information within the annual report.-
 1
1 -
2
-
3
-
4
-
5
-
6
-
7
-
8
-
9
-
10
-
11
-
12
-
13
-
14
-
15
-
16
-
17
-
18
-
19
-
20
-
21
-
22
-
23
-
24
-
25
-
26
-
27
-
28
-
29
-
30
-
31
-
32
-
33
-
34
-
35
-
36
-
37
-
38
-
39
-
40
-
41
-
42
-
43
-
44
-
45
-
46
-
47
-
48
-
49
-
50
-
51
-
52
-
53
-
54
-
55
-
56
-
57
-
58
-
59
-
60
-
61
-
62
-
63
-
64
-
65
-
66
-
67
-
68
-
69
-
70
-
71
-
72
-
73
-
74
-
75
-
76
-
77
-
78
-
 79
79 -
 80
80 -
 81
81 -
 82
82 -
 83
83 -
 84
84 -
 85
85 -
 86
86 -
 87
87 -
 88
88 -
 89
89 -
 90
90 -
 91
91 -
 92
92 -
 93
93 -
 94
94 -
 95
95 -
 96
96 -
 97
97 -
 98
98 -
 99
99 -
100
-
101
-
102
-
103
-
104
-
105
-
106
-
107
-
108
-
109
-
110
-
111
-
112
-
113
-
114
-
115
-
116
-
117
-
118
-
119
-
120
-
121
-
122
-
123
-
124
-
125
-
126
-
127
-
128
-
129
-
130
-
131
-
132
-
133
-
134
-
135
-
136
-
137
-
138
-
139
-
140
-
141
-
142
-
143
-
144
-
145
-
146
-
147
-
148
-
149
-
150
-
151
-
152
-
153
-
154
-
155
 |
 |
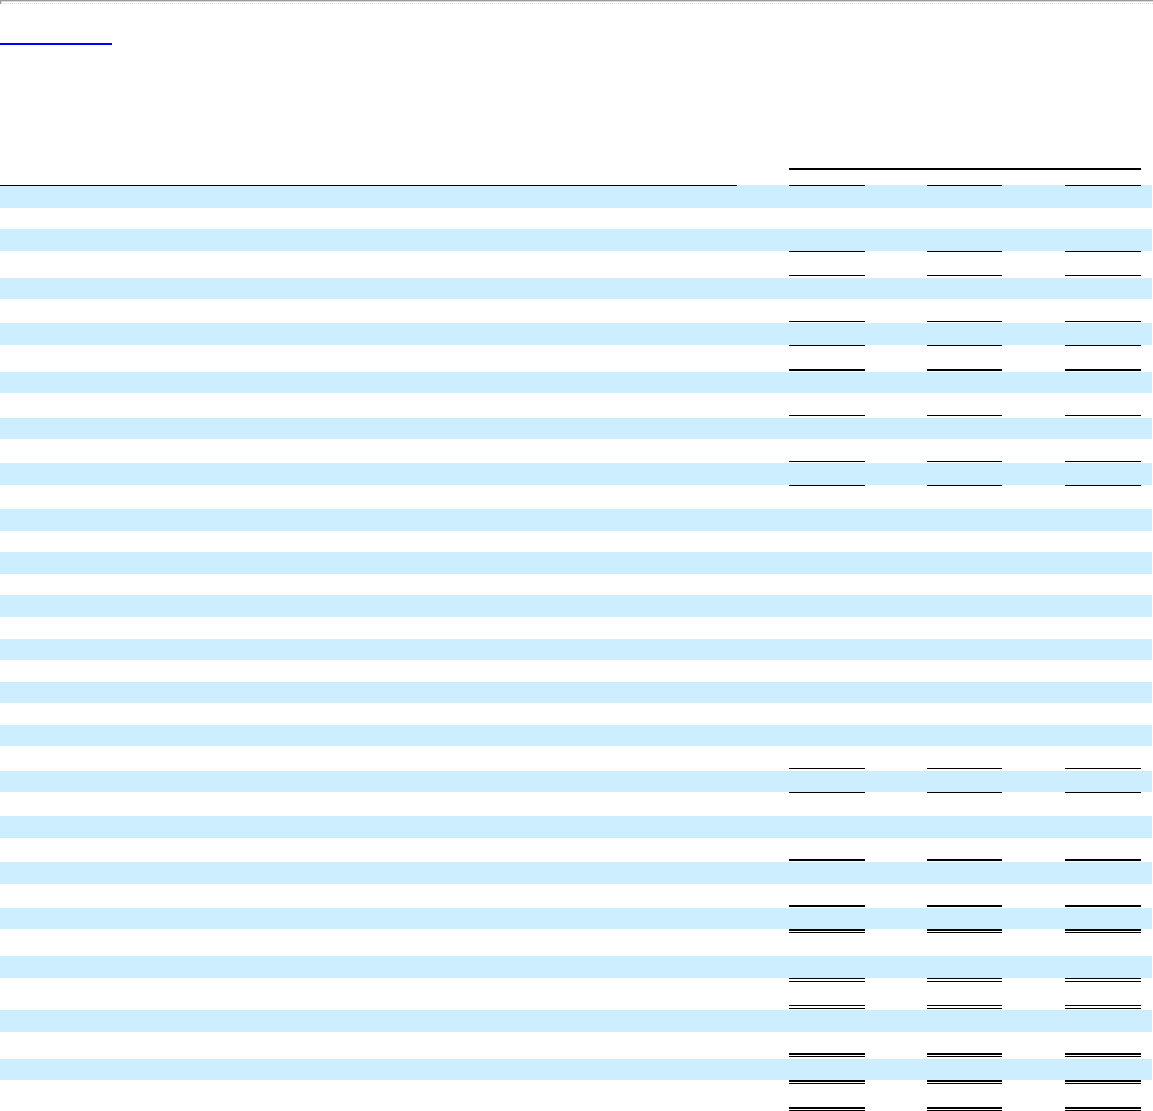
Table of Contents
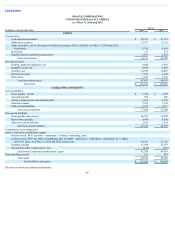
ORACLE CORPORATION
CONSOLIDATED STATEMENTS OF OPERATIONS
For the Years Ended May 31, 2016, 2015 and 2014
Year Ended May 31,
(in millions, except per share data) 2016 2015 2014
Revenues:
Cloud software as a service and platform as a service $ 2,207 $ 1,485 $ 1,121
Cloud infrastructure as a service 646 608 456
Total cloud revenues 2,853 2,093 1,577
New software licenses 7,276 8,535 9,416
Software license updates and product support 18,861 18,847 18,206
Total on-premise software revenues 26,137 27,382 27,622
Total cloud and on-premise software revenues 28,990 29,475 29,199
Hardware products 2,471 2,825 2,976
Hardware support 2,197 2,380 2,396
Total hardware revenues 4,668 5,205 5,372
Total services revenues 3,389 3,546 3,704
Total revenues 37,047 38,226 38,275
Operating expenses:
Sales and marketing 7,884 7,655 7,567
Cloud software as a service and platform as a service 1,152 773 455
Cloud infrastructure as a service 366 344 308
Software license updates and product support 1,146 1,199 1,162
Hardware products 1,371 1,471 1,521
Hardware support 693 816 836
Services 2,751 2,929 2,954
Research and development 5,787 5,524 5,151
General and administrative 1,155 1,077 1,038
Amortization of intangible assets 1,638 2,149 2,300
Acquisition related and other 42 211 41
Restructuring 458 207 183
Total operating expenses 24,443 24,355 23,516
Operating income 12,604 13,871 14,759
Interest expense (1,467) (1,143) (914)
Non-operating income (expense), net 305 106 (141)
Income before provision for income taxes 11,442 12,834 13,704
Provision for income taxes 2,541 2,896 2,749
Net income $ 8,901 $ 9,938 $ 10,955
Earnings per share:
Basic $ 2.11 $ 2.26 $ 2.42
Diluted $ 2.07 $ 2.21 $ 2.38
Weighted average common shares outstanding:
Basic 4,221 4,404 4,528
Diluted 4,305 4,503 4,604
Dividends declared per common share $ 0.60 $ 0.51 $ 0.48
Exclusive of amortization of intangible assets, which is shown separately
See notes to consolidated financial statements.
87
(1)
(1)
(1)
(1)
(1)
(1)
(1)
(1)