Oracle 2015 Annual Report Download - page 71
Download and view the complete annual report
Please find page 71 of the 2015 Oracle annual report below. You can navigate through the pages in the report by either clicking on the pages listed below, or by using the keyword search tool below to find specific information within the annual report.-
 1
1 -
2
-
3
-
4
-
5
-
6
-
7
-
8
-
9
-
10
-
11
-
12
-
13
-
14
-
15
-
16
-
17
-
18
-
19
-
20
-
21
-
22
-
23
-
24
-
25
-
26
-
27
-
28
-
29
-
30
-
31
-
32
-
33
-
34
-
35
-
36
-
37
-
38
-
39
-
40
-
41
-
42
-
43
-
44
-
45
-
46
-
47
-
48
-
49
-
50
-
51
-
52
-
53
-
54
-
55
-
56
-
57
-
58
-
59
-
60
-
 61
61 -
 62
62 -
 63
63 -
 64
64 -
 65
65 -
 66
66 -
 67
67 -
 68
68 -
 69
69 -
 70
70 -
 71
71 -
 72
72 -
 73
73 -
 74
74 -
 75
75 -
 76
76 -
 77
77 -
 78
78 -
 79
79 -
 80
80 -
 81
81 -
82
-
83
-
84
-
85
-
86
-
87
-
88
-
89
-
90
-
91
-
92
-
93
-
94
-
95
-
96
-
97
-
98
-
99
-
100
-
101
-
102
-
103
-
104
-
105
-
106
-
107
-
108
-
109
-
110
-
111
-
112
-
113
-
114
-
115
-
116
-
117
-
118
-
119
-
120
-
121
-
122
-
123
-
124
-
125
-
126
-
127
-
128
-
129
-
130
-
131
-
132
-
133
-
134
-
135
-
136
-
137
-
138
-
139
-
140
-
141
-
142
-
143
-
144
-
145
-
146
-
147
-
148
-
149
-
150
-
151
-
152
-
153
-
154
-
155
 |
 |

Table of Contents
Restructuring expenses in fiscal 2016 primarily related to our 2015 Restructuring Plan. Restructuring expenses in fiscal 2015 primarily related to our 2015
Restructuring Plan and our 2013 Restructuring Plan. Restructuring expenses in fiscal 2014 primarily related to our 2013 Restructuring Plan. Actions pursuant to the
aforementioned plans were substantially complete as of May 31, 2016. We may incur restructuring expenses in future periods due to the initiation of new
restructuring plans or from changes in estimated costs associated with legacy restructuring plans.
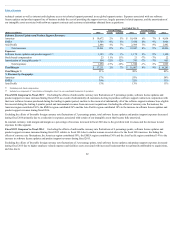
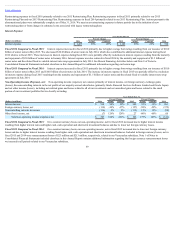
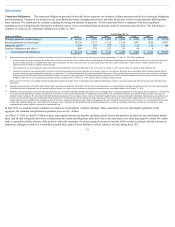
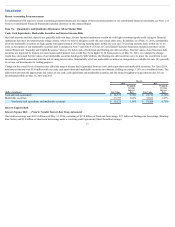
Interest Expense:
Year Ended May 31,
Percent Change Percent Change
(Dollars in millions) 2016 Actual Constant 2015 Actual Constant 2014
Interest expense $ 1,467 28% 28% $ 1,143 25% 25% $ 914
Fiscal 2016 Compared to Fiscal 2015: Interest expense increased in fiscal 2016 primarily due to higher average borrowings resulting from our issuance of $10.0
billion of senior notes in May 2015. We also issued $10.0 billion of senior notes in July 2014, which also contributed to additional interest expense during fiscal
2016 relative to fiscal 2015. These increases in interest expense during fiscal 2016 were partially offset by reductions in interest expense resulting from the maturity
and repayment of $2.0 billion of senior notes in January 2016. Interest expense was also reduced in fiscal 2016 by the maturity and repayment of $1.5 billion of
senior notes and the related fixed to variable interest rate swap agreements in July 2014. See Recent Financing Activities below and Note 8 of Notes to
Consolidated Financial Statements included elsewhere in this Annual Report for additional information regarding our borrowings.
Fiscal 2015 Compared to Fiscal 2014: Interest expense increased in fiscal 2015 primarily due to higher average borrowings resulting from our issuance of $10.0
billion of senior notes in May 2015 and $10.0 billion of senior notes in July 2014. The increase in interest expense in fiscal 2015 was partially offset by a reduction
in interest expense during fiscal 2015 resulting from the maturity and repayment of $1.5 billion of senior notes and the related fixed to variable interest rate swap
agreements in July 2014.
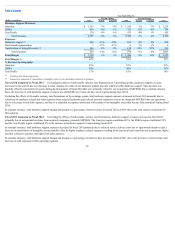
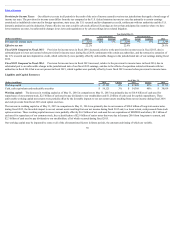
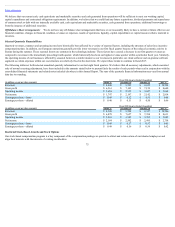
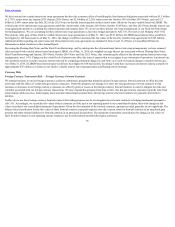
Non-Operating Income (Expense), net: Non-operating income (expense), net consists primarily of interest income, net foreign currency exchange gains
(losses), the noncontrolling interests in the net profits of our majority-owned subsidiaries (primarily Oracle Financial Services Software Limited and Oracle Japan)
and net other income (losses), including net realized gains and losses related to all of our investments and net unrealized gains and losses related to the small
portion of our investment portfolio that we classify as trading.
Year Ended May 31,
Percent Change Percent Change
(Dollars in millions) 2016 Actual Constant 2015 Actual Constant 2014
Interest income $ 538 54% 59% $ 349 33% 33% $ 263
Foreign currency losses, net (110) -30% -37% (157) -58% -59% (375)
Noncontrolling interests in income (116) 2% 2% (113) 15% 15% (98)
Other (loss) income, net (7) 126% 126% 27 -60% -60% 69
Total non-operating income (expense), net $ 305 188% 221% $ 106 175% 187% $ (141)
Fiscal 2016 Compared to Fiscal 2015: On a constant currency basis, our non-operating income, net for fiscal 2016 increased due to higher interest income
resulting from higher interest rates and higher cash, cash equivalent and short-term investment balances and due to lower net foreign currency losses.
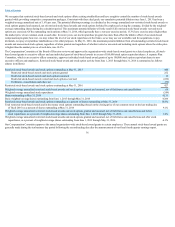
Fiscal 2015 Compared to Fiscal 2014: On a constant currency basis, our non-operating income, net in fiscal 2015 increased due to lower net foreign currency
losses and due to higher interest income resulting from higher cash, cash equivalent and short-term investment balances. Included in foreign currency losses, net in
fiscal 2015 and 2014 were remeasurement losses of $23 million and $213 million, respectively, related to our Venezuelan subsidiary. Note 1 of Notes to
Consolidated Financial Statements included elsewhere in this Annual Report contains additional information regarding the foreign currency remeasurement losses
we incurred in all periods related to our Venezuelan subsidiary.
69