Oracle 2015 Annual Report Download - page 69
Download and view the complete annual report
Please find page 69 of the 2015 Oracle annual report below. You can navigate through the pages in the report by either clicking on the pages listed below, or by using the keyword search tool below to find specific information within the annual report.-
 1
1 -
2
-
3
-
4
-
5
-
6
-
7
-
8
-
9
-
10
-
11
-
12
-
13
-
14
-
15
-
16
-
17
-
18
-
19
-
20
-
21
-
22
-
23
-
24
-
25
-
26
-
27
-
28
-
29
-
30
-
31
-
32
-
33
-
34
-
35
-
36
-
37
-
38
-
39
-
40
-
41
-
42
-
43
-
44
-
45
-
46
-
47
-
48
-
49
-
50
-
51
-
52
-
53
-
54
-
55
-
56
-
57
-
58
-
 59
59 -
 60
60 -
 61
61 -
 62
62 -
 63
63 -
 64
64 -
 65
65 -
 66
66 -
 67
67 -
 68
68 -
 69
69 -
 70
70 -
 71
71 -
 72
72 -
 73
73 -
 74
74 -
 75
75 -
 76
76 -
 77
77 -
 78
78 -
 79
79 -
80
-
81
-
82
-
83
-
84
-
85
-
86
-
87
-
88
-
89
-
90
-
91
-
92
-
93
-
94
-
95
-
96
-
97
-
98
-
99
-
100
-
101
-
102
-
103
-
104
-
105
-
106
-
107
-
108
-
109
-
110
-
111
-
112
-
113
-
114
-
115
-
116
-
117
-
118
-
119
-
120
-
121
-
122
-
123
-
124
-
125
-
126
-
127
-
128
-
129
-
130
-
131
-
132
-
133
-
134
-
135
-
136
-
137
-
138
-
139
-
140
-
141
-
142
-
143
-
144
-
145
-
146
-
147
-
148
-
149
-
150
-
151
-
152
-
153
-
154
-
155
 |
 |

Table of Contents
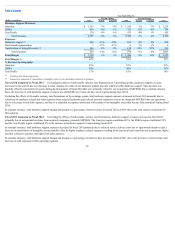
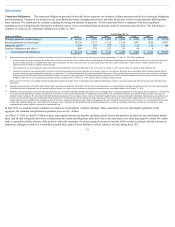
Fiscal 2015 Compared to Fiscal 2014: Excluding the effects of unfavorable currency rate fluctuations, our total services revenues were flat in fiscal 2015 as
incremental revenues from acquired companies, including MICROS, and an increase in fiscal 2015 advanced customer services revenues were offset by declines in
our fiscal 2015 consulting and education revenues. In constant currency, revenues growth in the EMEA region was offset by revenue declines in the Americas and
Asia Pacific regions during fiscal 2015.
Excluding the effects of favorable currency rate fluctuations, our total services expenses increased during fiscal 2015 due to higher employee related expenses
resulting from increased headcount from our acquisitions and were partially offset by lower variable compensation and lower external contractor costs.
In constant currency, total margin and margin as a percentage of total revenues decreased in fiscal 2015 due to the increase in total expenses for this business.
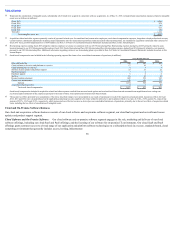
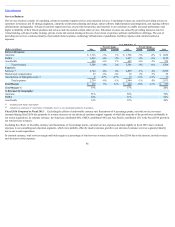
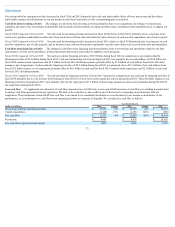
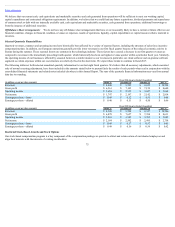
Research and Development Expenses: Research and development expenses consist primarily of personnel related expenditures. We intend to continue to invest
significantly in our research and development efforts because, in our judgment, they are essential to maintaining our competitive position.
Year Ended May 31,
Percent Change Percent Change
(Dollars in millions) 2016 Actual Constant 2015 Actual Constant 2014
Research and development $ 5,178 4% 5% $ 5,002 5% 6% $ 4,766
Stock-based compensation 609 17% 17% 522 36% 36% 385
Total expenses $ 5,787 5% 7% $ 5,524 7% 8% $ 5,151
% of Total Revenues 16% 14% 13%
Excluding stock-based compensation
On a constant currency basis, total research and development expenses increased during fiscal 2016 and fiscal 2015, each relative to the corresponding prior fiscal
year, primarily due to increased employee related expenses resulting from increased headcount, including additional headcount from our acquisitions, and also due
to increased infrastructure expenses.
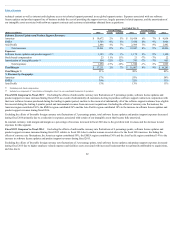
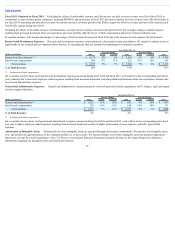
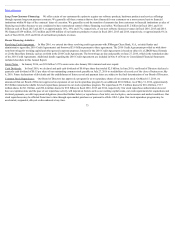
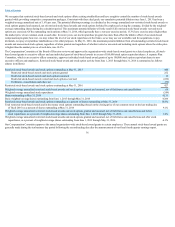
General and Administrative Expenses: General and administrative expenses primarily consist of personnel related expenditures for IT, finance, legal and human
resources support functions.
Year Ended May 31,
Percent Change Percent Change
(Dollars in millions) 2016 Actual Constant 2015 Actual Constant 2014
General and administrative $ 1,035 11% 16% $ 929 7% 10% $ 867
Stock-based compensation 120 -19% -19% 148 -14% -14% 171
Total expenses $ 1,155 7% 11% $ 1,077 4% 7% $ 1,038
% of Total Revenues 3% 3% 3%
Excluding stock-based compensation
On a constant currency basis, total general and administrative expenses increased during fiscal 2016 and fiscal 2015, each relative to the corresponding prior fiscal
year, due to higher employee related expenses resulting from increased headcount and due to higher professional services expenses, primarily legal related
expenses.
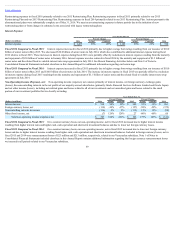
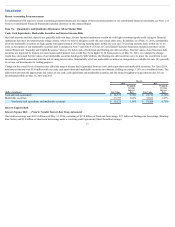
Amortization of Intangible Assets: Substantially all of our intangible assets are acquired through our business combinations. We amortize our intangible assets
over, and monitor the appropriateness of, the estimated useful lives of these assets. We also periodically review these intangible assets for potential impairment
based upon relevant facts and circumstances. Note 7 of Notes to Consolidated Financial Statements included elsewhere in this Annual Report has additional
information regarding our intangible assets and related amortization.
67
(1)
(1)
(1)
(1)