Oracle 2015 Annual Report Download - page 125
Download and view the complete annual report
Please find page 125 of the 2015 Oracle annual report below. You can navigate through the pages in the report by either clicking on the pages listed below, or by using the keyword search tool below to find specific information within the annual report.-
 1
1 -
2
-
3
-
4
-
5
-
6
-
7
-
8
-
9
-
10
-
11
-
12
-
13
-
14
-
15
-
16
-
17
-
18
-
19
-
20
-
21
-
22
-
23
-
24
-
25
-
26
-
27
-
28
-
29
-
30
-
31
-
32
-
33
-
34
-
35
-
36
-
37
-
38
-
39
-
40
-
41
-
42
-
43
-
44
-
45
-
46
-
47
-
48
-
49
-
50
-
51
-
52
-
53
-
54
-
55
-
56
-
57
-
58
-
59
-
60
-
61
-
62
-
63
-
64
-
65
-
66
-
67
-
68
-
69
-
70
-
71
-
72
-
73
-
74
-
75
-
76
-
77
-
78
-
79
-
80
-
81
-
82
-
83
-
84
-
85
-
86
-
87
-
88
-
89
-
90
-
91
-
92
-
93
-
94
-
95
-
96
-
97
-
98
-
99
-
100
-
101
-
102
-
103
-
104
-
105
-
106
-
107
-
108
-
109
-
110
-
111
-
112
-
113
-
114
-
 115
115 -
 116
116 -
 117
117 -
 118
118 -
 119
119 -
 120
120 -
 121
121 -
 122
122 -
 123
123 -
 124
124 -
 125
125 -
 126
126 -
 127
127 -
 128
128 -
 129
129 -
 130
130 -
 131
131 -
 132
132 -
 133
133 -
 134
134 -
 135
135 -
136
-
137
-
138
-
139
-
140
-
141
-
142
-
143
-
144
-
145
-
146
-
147
-
148
-
149
-
150
-
151
-
152
-
153
-
154
-
155
 |
 |

Table of Contents
ORACLE CORPORATION
NOTES TO CONSOLIDATED FINANCIAL STATEMENTS—(Continued)
May 31, 2016
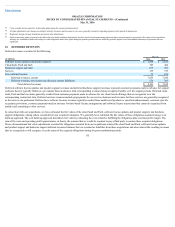
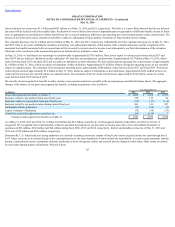
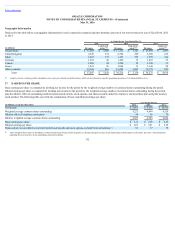
Options outstanding that have vested and that are expected to vest as of May 31, 2016 were as follows:
Outstanding
Options
(in millions)
Weighted-
Average
Exercise
Price
Weighted-
Average
Remaining
Contract Term
(in years)
In-the-Money
Options as of
May 31, 2016
(in millions)
Aggregate
Intrinsic
Value
(in millions)
Vested 253 $ 27.52 4.83 245 $ 3,232
Expected to vest 115 $ 33.91 7.20 76 736
Total 368 $ 29.52 5.57 321 $ 3,968
The aggregate intrinsic value was calculated based on the gross difference between our closing stock price on the last trading day of fiscal 2016 of $40.20 and the exercise prices for all “in-the-money”
options outstanding, excluding tax effects.
The unrecognized compensation expense calculated under the fair value method for shares expected to vest (unvested shares net of expected forfeitures) as of May 31, 2016 was approximately $474 million
and is expected to be recognized over a weighted-average period of 2.02 years. Approximately 7 million shares outstanding as of May 31, 2016 were not expected to vest.
Stock-Based Compensation Expense and Valuation of Stock Awards
We estimated the fair values of our restricted stock-based awards that are solely subject to service-based vesting requirements based upon their intrinsic values as
of the grant dates.
The fair values of our PSUs were also measured based upon their intrinsic values as of their respective grant dates. The vesting conditions and related terms of our
PSUs were communicated to each participating employee as of their respective grant dates and included attainment metrics that were defined, fixed and based upon
consistent U.S. GAAP metrics or internal metrics that are defined, fixed and consistently determined, and that require the employee to render service. Therefore,
these awards met the performance-based award classification criteria as defined within ASC 718.
We estimated the fair values of our stock options using the Black-Scholes-Merton option-pricing model, which was developed for use in estimating the fair values
of stock options. Option valuation models, including the Black-Scholes-Merton option-pricing model, require the input of assumptions, including stock price
volatility. Changes in the input assumptions can affect the fair value estimates and ultimately how much we recognize as stock-based compensation expense. The
fair values of our stock options were estimated at the grant dates or at the acquisition dates for options assumed in a business combination. The weighted-average
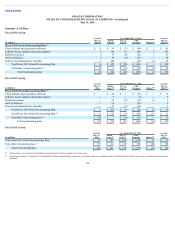
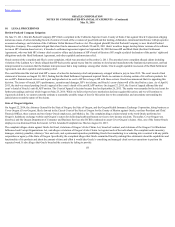
input assumptions used and resulting fair values of our stock options were as follows for fiscal 2016, 2015 and 2014:
Year Ended May 31,
2016 2015 2014
Expected life (in years) 4.8 5.1 4.9
Risk-free interest rate 1.6% 1.7% 1.3%
Volatility 24% 23% 27%
Dividend yield 1.5% 1.2% 1.5%
Weighted-average fair value per share $ 8.49 $ 9.62 $ 7.47
The expected life input is based on historical exercise patterns and post-vesting termination behavior, the risk-free interest rate input is based on U.S. Treasury
instruments, the annualized dividend yield input is based on the per share dividend declared by our Board of Directors and the volatility input is calculated based on
the implied volatility of our publicly traded options.
123
(1)
(2)
(1)
(2)