Oracle 2015 Annual Report Download - page 58
Download and view the complete annual report
Please find page 58 of the 2015 Oracle annual report below. You can navigate through the pages in the report by either clicking on the pages listed below, or by using the keyword search tool below to find specific information within the annual report.-
 1
1 -
2
-
3
-
4
-
5
-
6
-
7
-
8
-
9
-
10
-
11
-
12
-
13
-
14
-
15
-
16
-
17
-
18
-
19
-
20
-
21
-
22
-
23
-
24
-
25
-
26
-
27
-
28
-
29
-
30
-
31
-
32
-
33
-
34
-
35
-
36
-
37
-
38
-
39
-
40
-
41
-
42
-
43
-
44
-
45
-
46
-
47
-
 48
48 -
 49
49 -
 50
50 -
 51
51 -
 52
52 -
 53
53 -
 54
54 -
 55
55 -
 56
56 -
 57
57 -
 58
58 -
 59
59 -
 60
60 -
 61
61 -
 62
62 -
 63
63 -
 64
64 -
 65
65 -
 66
66 -
 67
67 -
 68
68 -
69
-
70
-
71
-
72
-
73
-
74
-
75
-
76
-
77
-
78
-
79
-
80
-
81
-
82
-
83
-
84
-
85
-
86
-
87
-
88
-
89
-
90
-
91
-
92
-
93
-
94
-
95
-
96
-
97
-
98
-
99
-
100
-
101
-
102
-
103
-
104
-
105
-
106
-
107
-
108
-
109
-
110
-
111
-
112
-
113
-
114
-
115
-
116
-
117
-
118
-
119
-
120
-
121
-
122
-
123
-
124
-
125
-
126
-
127
-
128
-
129
-
130
-
131
-
132
-
133
-
134
-
135
-
136
-
137
-
138
-
139
-
140
-
141
-
142
-
143
-
144
-
145
-
146
-
147
-
148
-
149
-
150
-
151
-
152
-
153
-
154
-
155
 |
 |

Table of Contents
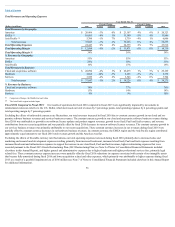
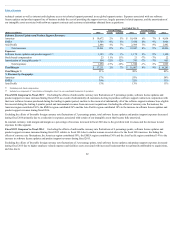
Total Revenues and Operating Expenses
Year Ended May 31,
Percent Change Percent Change
(Dollars in millions) 2016 Actual Constant 2015 Actual Constant 2014
Total Revenues by Geography:
Americas $ 20,466 -3% 0% $ 21,107 4% 6% $ 20,323
EMEA 10,881 -4% 3% 11,380 -5% 4% 11,946
Asia Pacific 5,700 -1% 7% 5,739 -4% 1% 6,006
Total revenues 37,047 -3% 2% 38,226 0% 4% 38,275
Total Operating Expenses 24,443 0% 4% 24,355 4% 7% 23,516
Total Operating Margin $ 12,604 -9% -2% $ 13,871 -6% 0% $ 14,759
Total Operating Margin % 34% 36% 39%
% Revenues by Geography:
Americas 55% 55% 53%
EMEA 29% 30% 31%
Asia Pacific 16% 15% 16%
Total Revenues by Business:
Cloud and on-premise software $ 28,990 -2% 3% $ 29,475 1% 5% $ 29,199
Hardware 4,668 -10% -5% 5,205 -3% 2% 5,372
Services 3,389 -4% 2% 3,546 -4% 0% 3,704
Total revenues $ 37,047 -3% 2% $ 38,226 0% 4% $ 38,275
% Revenues by Business:
Cloud and on-premise software 78% 77% 76%
Hardware 13% 14% 14%
Services 9% 9% 10%
Comprised of Europe, the Middle East and Africa
The Asia Pacific region includes Japan
Fiscal 2016 Compared to Fiscal 2015: Our results of operations for fiscal 2016 compared to fiscal 2015 were significantly impacted by movements in
international currencies relative to the U.S. Dollar, which decreased our total revenues by 5 percentage points, total operating expenses by 4 percentage points and
total operating margin by 7 percentage points.
Excluding the effects of unfavorable currency rate fluctuations, our total revenues increased in fiscal 2016 due to constant currency growth in our cloud and on-
premise software business revenues and services business revenues. The constant currency growth in our cloud and on-premise software business revenues during
fiscal 2016 was attributable to growth in our software license updates and product support revenues, growth in our SaaS, PaaS and IaaS revenues, and revenue
contributions from our recent acquisitions and was partially offset by fiscal 2016 decreases in our new software licenses revenues. The constant currency growth in
our services business revenues was primarily attributable to our recent acquisitions. These constant currency increases in our revenues during fiscal 2016 were
partially offset by constant currency decreases in our hardware business revenues. In constant currency, the EMEA region and the Asia Pacific region contributed
approximately equal amounts to our fiscal 2016 total revenues growth and the Americas was flat.
Excluding the effects of favorable currency rate fluctuations, our total operating expenses increased during fiscal 2016 primarily due to increased sales and
marketing and research and development expenses resulting primarily from increased headcount, increased cloud SaaS, PaaS and IaaS expenses resulting from
increased headcount and infrastructure expenses to support the increase in our cloud SaaS, PaaS and IaaS revenues, higher restructuring expenses that were
recorded pursuant to the Fiscal 2015 Oracle Restructuring Plan (2015 Restructuring Plan; see Note 9 of Notes to Consolidated Financial Statements included
elsewhere in this Annual Report), and higher general and administrative expenses due to higher headcount and higher professional services fees, primarily legal
related fees. These constant currency expense increases were partially offset by fiscal 2016 reductions in expenses associated with certain of our intangible assets
that became fully amortized during fiscal 2016 and lower acquisition related and other expenses, which primarily was attributable to higher expenses during fiscal
2015 as a result of a goodwill impairment loss of $186 million (see Note 7 of Notes to Consolidated Financial Statements included elsewhere in this Annual Report
for additional information).
56
(1)
(2)
(1)
(2)