Oracle 2015 Annual Report Download - page 63
Download and view the complete annual report
Please find page 63 of the 2015 Oracle annual report below. You can navigate through the pages in the report by either clicking on the pages listed below, or by using the keyword search tool below to find specific information within the annual report.-
 1
1 -
2
-
3
-
4
-
5
-
6
-
7
-
8
-
9
-
10
-
11
-
12
-
13
-
14
-
15
-
16
-
17
-
18
-
19
-
20
-
21
-
22
-
23
-
24
-
25
-
26
-
27
-
28
-
29
-
30
-
31
-
32
-
33
-
34
-
35
-
36
-
37
-
38
-
39
-
40
-
41
-
42
-
43
-
44
-
45
-
46
-
47
-
48
-
49
-
50
-
51
-
52
-
 53
53 -
 54
54 -
 55
55 -
 56
56 -
 57
57 -
 58
58 -
 59
59 -
 60
60 -
 61
61 -
 62
62 -
 63
63 -
 64
64 -
 65
65 -
 66
66 -
 67
67 -
 68
68 -
 69
69 -
 70
70 -
 71
71 -
 72
72 -
 73
73 -
74
-
75
-
76
-
77
-
78
-
79
-
80
-
81
-
82
-
83
-
84
-
85
-
86
-
87
-
88
-
89
-
90
-
91
-
92
-
93
-
94
-
95
-
96
-
97
-
98
-
99
-
100
-
101
-
102
-
103
-
104
-
105
-
106
-
107
-
108
-
109
-
110
-
111
-
112
-
113
-
114
-
115
-
116
-
117
-
118
-
119
-
120
-
121
-
122
-
123
-
124
-
125
-
126
-
127
-
128
-
129
-
130
-
131
-
132
-
133
-
134
-
135
-
136
-
137
-
138
-
139
-
140
-
141
-
142
-
143
-
144
-
145
-
146
-
147
-
148
-
149
-
150
-
151
-
152
-
153
-
154
-
155
 |
 |
Table of Contents
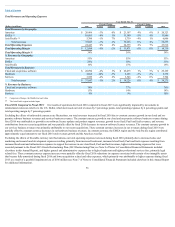
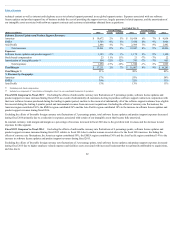
Year Ended May 31,
Percent Change Percent Change
(Dollars in millions) 2016 Actual Constant 2015 Actual Constant 2014
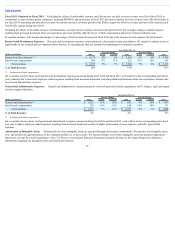
Cloud Infrastructure as a Service Revenues:
Americas $ 470 6% 9% $ 444 33% 35% $ 335
EMEA 139 7% 14% 129 37% 41% 94
Asia Pacific 37 7% 21% 35 28% 39% 27
Total revenues 646 6% 11% 608 33% 36% 456
Expenses:
Cloud infrastructure as a service 362 6% 10% 339 12% 14% 304
Sales and marketing 76 -16% -14% 90 46% 50% 61
Stock-based compensation 5 -2% -2% 5 27% 27% 4
Amortization of intangible assets 5 34% 34% 4 * * —
Total expenses 448 2% 5% 438 19% 21% 369
Total Margin $ 198 17% 24% $ 170 97% 103% $ 87
Total Margin % 31% 28% 19%
% Revenues by Geography:
Americas 73% 73% 73%
EMEA 21% 21% 21%
Asia Pacific 6% 6% 6%
Excluding stock-based compensation
Included as a component of ‘Amortization of Intangible Assets’ in our consolidated statements of operations
Not meaningful
Fiscal 2016 Compared to Fiscal 2015: Excluding the effects of unfavorable currency rate fluctuations of 5 percentage points, total cloud IaaS revenues
increased during fiscal 2016 due to growth in our Oracle Managed Cloud Services offerings and incremental revenue contributions from our recent acquisitions.
Excluding the effects of currency rate fluctuations, the Americas region contributed 62%, the EMEA region contributed 27% and the Asia Pacific region
contributed 11% to the increase in cloud IaaS revenues during fiscal 2016.
On a constant currency basis, total cloud IaaS expenses increased during fiscal 2016 primarily due to increased infrastructure expenses to support our increase in
cloud IaaS revenues.
Excluding the effects of unfavorable currency exchange variances, total margin and margin as a percentage of revenues increased in fiscal 2016 as total revenues
increased at a faster rate than our total expenses for this operating segment.
Fiscal 2015 Compared to Fiscal 2014: On a constant currency basis, total cloud IaaS revenues increased during fiscal 2015 primarily due to contributions from
our acquisitions. Excluding the effects of currency rate fluctuations, the Americas region contributed 70%, the EMEA region contributed 24% and the Asia Pacific
region contributed 6% to the increase in cloud IaaS revenues during fiscal 2015.
On a constant currency basis, total cloud IaaS expenses increased in fiscal 2015 primarily due to increased employee related expenses associated with increased
headcount and increased infrastructure expenses to support our increase in IaaS revenues.
Excluding the effects of unfavorable currency exchange variances, total margin and margin as a percentage of revenues increased in fiscal 2015 as total revenues
increased at a faster rate than our total expenses for this operating segment.
Software License Updates and Product Support: Software license updates and product support revenues are typically generated through the sale of software
support contracts related to on-premise new software licenses purchased by our customers. Our software license updates and product support offerings include
software license updates, which grant on-premise software customers rights to unspecified product upgrades and maintenance releases and patches released during
the support period, and product support including internet access to
61
(1)
(1)
(2)
(1)
(2)
*