Oracle 2015 Annual Report Download - page 61
Download and view the complete annual report
Please find page 61 of the 2015 Oracle annual report below. You can navigate through the pages in the report by either clicking on the pages listed below, or by using the keyword search tool below to find specific information within the annual report.-
 1
1 -
2
-
3
-
4
-
5
-
6
-
7
-
8
-
9
-
10
-
11
-
12
-
13
-
14
-
15
-
16
-
17
-
18
-
19
-
20
-
21
-
22
-
23
-
24
-
25
-
26
-
27
-
28
-
29
-
30
-
31
-
32
-
33
-
34
-
35
-
36
-
37
-
38
-
39
-
40
-
41
-
42
-
43
-
44
-
45
-
46
-
47
-
48
-
49
-
50
-
 51
51 -
 52
52 -
 53
53 -
 54
54 -
 55
55 -
 56
56 -
 57
57 -
 58
58 -
 59
59 -
 60
60 -
 61
61 -
 62
62 -
 63
63 -
 64
64 -
 65
65 -
 66
66 -
 67
67 -
 68
68 -
 69
69 -
 70
70 -
 71
71 -
72
-
73
-
74
-
75
-
76
-
77
-
78
-
79
-
80
-
81
-
82
-
83
-
84
-
85
-
86
-
87
-
88
-
89
-
90
-
91
-
92
-
93
-
94
-
95
-
96
-
97
-
98
-
99
-
100
-
101
-
102
-
103
-
104
-
105
-
106
-
107
-
108
-
109
-
110
-
111
-
112
-
113
-
114
-
115
-
116
-
117
-
118
-
119
-
120
-
121
-
122
-
123
-
124
-
125
-
126
-
127
-
128
-
129
-
130
-
131
-
132
-
133
-
134
-
135
-
136
-
137
-
138
-
139
-
140
-
141
-
142
-
143
-
144
-
145
-
146
-
147
-
148
-
149
-
150
-
151
-
152
-
153
-
154
-
155
 |
 |

Table of Contents
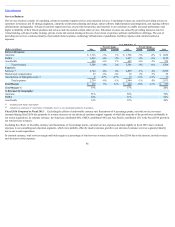
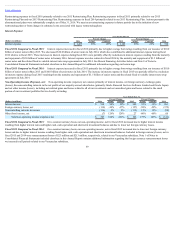
management, the use of software updates, and support. New software licenses revenues represent fees earned from granting customers licenses to use our database
and middleware and our application software products within on-premise IT environments. We continue to place significant emphasis, both domestically and
internationally, on direct sales through our own sales force. We also continue to market our products through indirect channels. Costs associated with our cloud
software and on-premise software segment are included in sales and marketing expenses, cloud SaaS and PaaS expenses and amortization of intangible assets.
These costs are largely personnel related and include commissions earned by our sales force for the sale of our software offerings, marketing program costs, the
cost of providing our cloud SaaS and PaaS offerings and amortization of intangible assets.
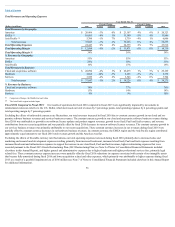
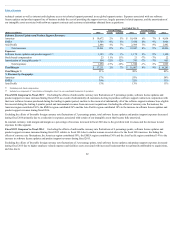
Year Ended May 31,
Percent Change Percent Change
(Dollars in millions) 2016 Actual Constant 2015 Actual Constant 2014
Cloud Software and On-Premise Software Revenues:
Americas $ 5,204 -9% -7% $ 5,742 4% 6% $ 5,544
EMEA 2,629 -3% 3% 2,715 -16% -8% 3,249
Asia Pacific 1,650 6% 12% 1,563 -10% -5% 1,744
Total revenues 9,483 -5% -1% 10,020 -5% 0% 10,537
Expenses:
Cloud software as a service and platform as a service 1,135 49% 53% 763 71% 76% 447
Sales and marketing 6,690 3% 9% 6,474 2% 6% 6,350
Stock-based compensation 223 24% 24% 179 8% 8% 166
Amortization of intangible assets 826 -18% -18% 1,008 3% 3% 977
Total expenses 8,874 5% 10% 8,424 6% 10% 7,940
Total Margin $ 609 -62% -59% $ 1,596 -39% -31% $ 2,597
Total Margin % 6% 16% 25%
% Revenues by Geography:
Americas 55% 57% 53%
EMEA 28% 27% 31%
Asia Pacific 17% 16% 16%
Revenues by Software Offerings:
Cloud software as a service and platform as a service $ 2,207 49% 52% $ 1,485 32% 35% $ 1,121
New software licenses 7,276 -15% -11% 8,535 -9% -4% 9,416
Total cloud software and on-premise software revenues $ 9,483 -5% -1% $ 10,020 -5% 0% $ 10,537
% Revenues by Software Offerings:
Cloud software as a service and platform as a service 23% 15% 11%
New software licenses 77% 85% 89%
Excluding stock-based compensation
Included as a component of ‘Amortization of Intangible Assets’ in our consolidated statements of operations
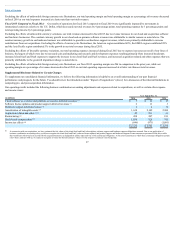
Fiscal 2016 Compared to Fiscal 2015: Excluding the effects of unfavorable currency rate fluctuations of 4 percentage points, total revenues from our cloud
software and on-premise software segment decreased by 1 percentage point during fiscal 2016 due to a reduction in new software licenses revenues, partially offset
by an increase in cloud SaaS and PaaS revenues and incremental revenue contributions from our recent acquisitions. The increase in our cloud SaaS and PaaS
revenues and decrease in our new software licenses revenues during fiscal 2016 were primarily due to the strategic emphasis placed on selling, marketing and
growing our cloud software offerings and we expect these revenue trends will continue. In constant currency, fiscal 2016 revenue declines in the Americas region
were partially offset by revenues growth in the EMEA and Asia Pacific regions.
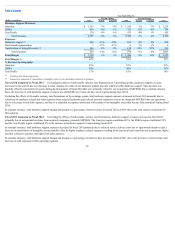
In reported currency, new software licenses revenues earned from transactions of $3 million or greater decreased by 24% in fiscal 2016 and represented 28% of our
new software licenses revenues in fiscal 2016 in comparison to 31% in fiscal 2015.
59
(1)
(1)
(2)
(1)
(2)