Oracle 2015 Annual Report Download - page 70
Download and view the complete annual report
Please find page 70 of the 2015 Oracle annual report below. You can navigate through the pages in the report by either clicking on the pages listed below, or by using the keyword search tool below to find specific information within the annual report.-
 1
1 -
2
-
3
-
4
-
5
-
6
-
7
-
8
-
9
-
10
-
11
-
12
-
13
-
14
-
15
-
16
-
17
-
18
-
19
-
20
-
21
-
22
-
23
-
24
-
25
-
26
-
27
-
28
-
29
-
30
-
31
-
32
-
33
-
34
-
35
-
36
-
37
-
38
-
39
-
40
-
41
-
42
-
43
-
44
-
45
-
46
-
47
-
48
-
49
-
50
-
51
-
52
-
53
-
54
-
55
-
56
-
57
-
58
-
59
-
 60
60 -
 61
61 -
 62
62 -
 63
63 -
 64
64 -
 65
65 -
 66
66 -
 67
67 -
 68
68 -
 69
69 -
 70
70 -
 71
71 -
 72
72 -
 73
73 -
 74
74 -
 75
75 -
 76
76 -
 77
77 -
 78
78 -
 79
79 -
 80
80 -
81
-
82
-
83
-
84
-
85
-
86
-
87
-
88
-
89
-
90
-
91
-
92
-
93
-
94
-
95
-
96
-
97
-
98
-
99
-
100
-
101
-
102
-
103
-
104
-
105
-
106
-
107
-
108
-
109
-
110
-
111
-
112
-
113
-
114
-
115
-
116
-
117
-
118
-
119
-
120
-
121
-
122
-
123
-
124
-
125
-
126
-
127
-
128
-
129
-
130
-
131
-
132
-
133
-
134
-
135
-
136
-
137
-
138
-
139
-
140
-
141
-
142
-
143
-
144
-
145
-
146
-
147
-
148
-
149
-
150
-
151
-
152
-
153
-
154
-
155
 |
 |
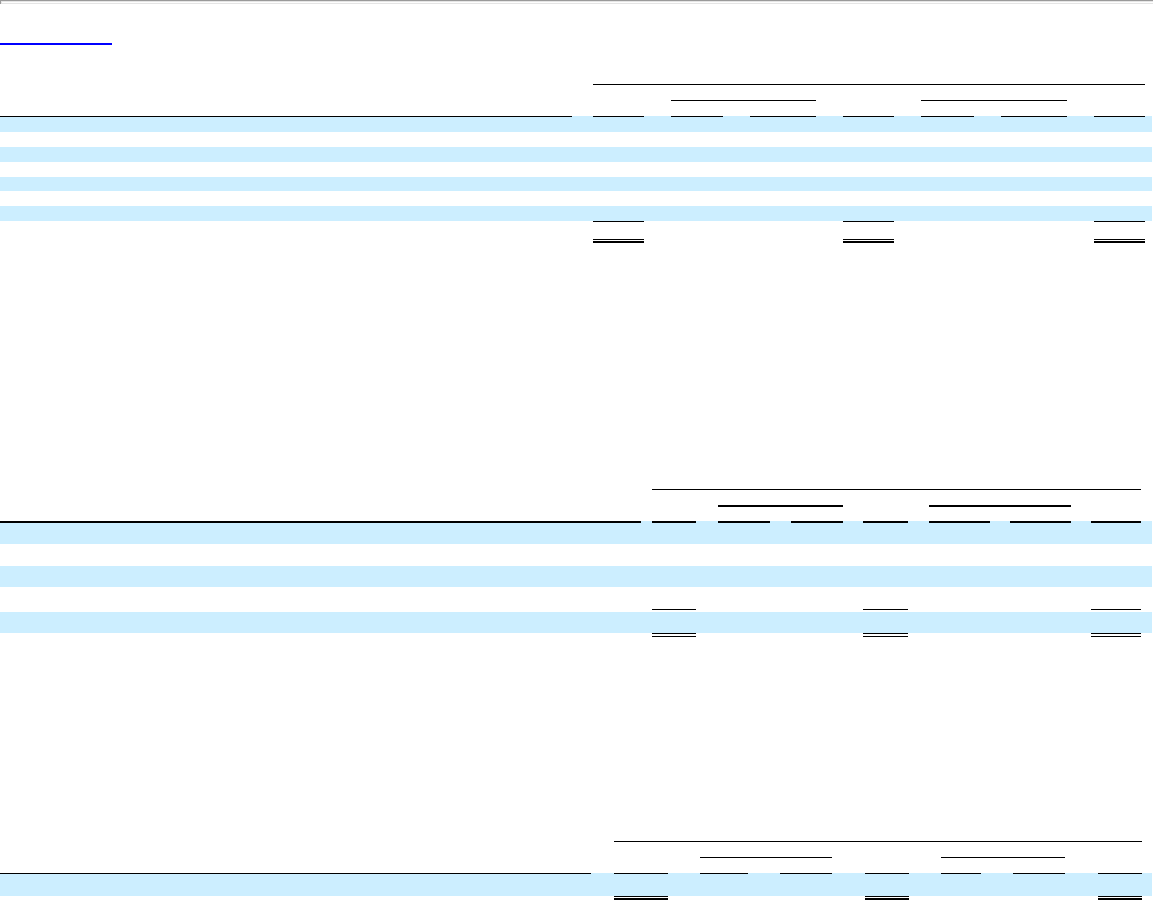
Table of Contents
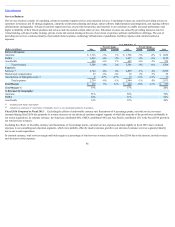
Year Ended May 31,
Percent Change Percent Change
(Dollars in millions) 2016 Actual Constant 2015 Actual Constant 2014
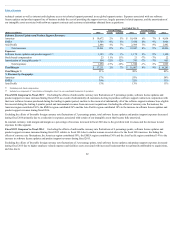
Software support agreements and related relationships $ 358 -33% -33% $ 531 -7% -7% $ 571
Hardware support agreements and related relationships 145 1% 1% 144 1% 1% 143
Developed technology 559 -20% -20% 700 -1% -1% 706
Core technology 89 -51% -51% 182 -43% -43% 318
Customer relationships and contract backlog 217 -30% -30% 312 -7% -7% 334
SaaS, PaaS and IaaS agreements and related relationships and other 212 4% 4% 203 35% 35% 150
Trademarks 58 -25% -25% 77 -1% -1% 78
Total amortization of intangible assets $ 1,638 -24% -24% $ 2,149 -7% -7% $ 2,300
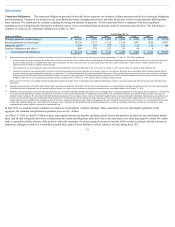
Amortization of intangible assets decreased during fiscal 2016 and fiscal 2015, each relative to the corresponding prior fiscal year, due to a reduction in expenses
associated with certain of our intangible assets that became fully amortized. These decreases were partially offset by additional amortization from intangible assets
associated with recently completed acquisitions. Note 7 of Notes to Consolidated Financial Statements included elsewhere in this Annual Report has additional
information regarding our intangible assets and related amortization.
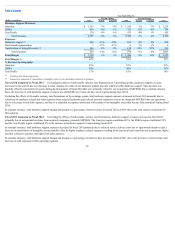
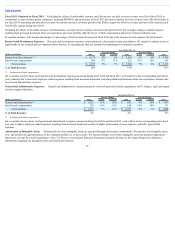
Acquisition Related and Other Expenses: Acquisition related and other expenses consist of personnel related costs for transitional and certain other employees,
stock-based compensation expenses, integration related professional services, certain business combination adjustments including certain adjustments after the
measurement period has ended and certain other operating items, net. Stock-based compensation expenses included in acquisition related and other expenses
resulted from unvested stock options and restricted stock-based awards assumed from acquisitions whereby vesting was accelerated upon termination of the
employees pursuant to the original terms of those stock options and restricted stock-based awards.
Year Ended May 31,
Percent Change Percent Change
(Dollars in millions) 2016 Actual Constant 2015 Actual Constant 2014
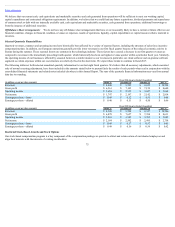
Transitional and other employee related costs $ 45 -20% -19% $ 57 112% 120% $ 27
Stock-based compensation 3 -43% -43% 5 -48% -48% 10
Professional fees and other, net 10 128% 128% (35) 274% 279% 20
Business combination adjustments, net (16) -109% -109% 184 1,235% 1,239% (16)
Total acquisition related and other expenses $ 42 -80% -80% $ 211 412% 411% $ 41
Acquisition related and other expenses decreased in fiscal 2016 and increased in fiscal 2015, each relative to the corresponding prior fiscal year, primarily due to a
$186 million goodwill impairment loss recorded during fiscal 2015. We also recorded an acquisition related benefit of $19 million and a litigation related benefit of
$53 million in fiscal 2016 and 2015, respectively, which reduced our expenses in those periods.
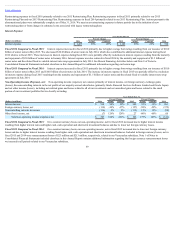
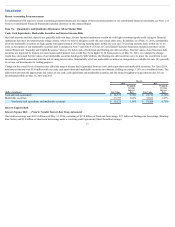
Restructuring Expenses: Restructuring expenses resulted from the execution of management approved restructuring plans that were generally developed to
improve our cost structure and/or operations, often in conjunction with our acquisition integration strategies. Restructuring expenses consist of employee severance
costs and may also include charges for duplicate facilities and other contract termination costs to improve our cost structure prospectively. For additional
information regarding our restructuring plans, see Note 9 of Notes to Consolidated Financial Statements included elsewhere in this Annual Report.
Year Ended May 31,
Percent Change Percent Change
(Dollars in millions) 2016 Actual Constant 2015 Actual Constant 2014
Restructuring expenses $ 458 121% 145% $ 207 14% 22% $ 183
68