Oracle 2015 Annual Report Download - page 68
Download and view the complete annual report
Please find page 68 of the 2015 Oracle annual report below. You can navigate through the pages in the report by either clicking on the pages listed below, or by using the keyword search tool below to find specific information within the annual report.
Table of Contents
Services Business
Our services business consists of consulting, advanced customer support services and education services. Consulting revenues are earned by providing services to
customers in business and IT strategy alignment, enterprise architecture planning and design, initial software implementation and integration, and ongoing software
enhancements and upgrades. Advanced customer support services are provided on-premise and remotely to our customers to enable increased performance and
higher availability of their Oracle products and services and also include certain other services. Education revenues are earned by providing instructor-led, live
virtual training, self-paced online training, private events and custom training in the use of our cloud, on-premise software and hardware offerings. The cost of
providing our services consists primarily of personnel related expenses, technology infrastructure expenditures, facilities expenses and external contractor
expenses.
Year Ended May 31,
Percent Change Percent Change
(Dollars in millions) 2016 Actual Constant 2015 Actual Constant 2014
Services Revenues:
Americas $ 1,716 -3% 1% $ 1,766 -5% -2% $ 1,850
EMEA 1,033 -6% 2% 1,097 -2% 6% 1,125
Asia Pacific 640 -6% 1% 683 -6% -1% 729
Total revenues 3,389 -4% 2% 3,546 -4% 0% 3,704
Expenses:
Services 2,722 -6% 0% 2,899 -1% 4% 2,925
Stock-based compensation 29 -6% -6% 30 2% 2% 29
Amortization of intangible assets 8 -47% -47% 15 -12% -12% 17
Total expenses 2,759 -6% -1% 2,944 -1% 4% 2,971
Total Margin $ 630 5% 12% $ 602 -18% -13% $ 733
Total Margin % 19% 17% 20%
% Revenues by Geography:
Americas 51% 50% 50%
EMEA 30% 31% 30%
Asia Pacific 19% 19% 20%
Excluding stock-based compensation
Included as a component of ‘Amortization of Intangible Assets’ in our consolidated statements of operations
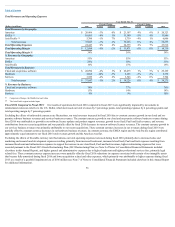
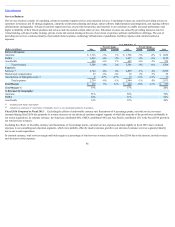
Fiscal 2016 Compared to Fiscal 2015: Excluding the effects of unfavorable currency rate fluctuations of 6 percentage points, our total services revenues
increased during fiscal 2016 due primarily to revenue increases in our advanced customer support segment of which the majority of the growth was attributable to
our recent acquisitions. In constant currency, the Americas contributed 44%, EMEA contributed 44% and Asia Pacific contributed 12% to the fiscal 2016 growth in
our total services revenues.
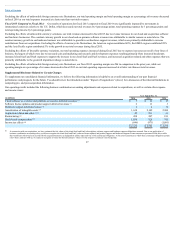
Excluding the effects of favorable currency rate fluctuations of 5 percentage points, our total services expenses declined slightly in fiscal 2016 due to reduced
expenses in our consulting and education segments, which were partially offset by modest expense growth in our advanced customer services segment primarily
due to our recent acquisitions.
In constant currency, total services margin and total margin as a percentage of total services revenues increased in fiscal 2016 due to the increase in total revenues
and decrease in total expenses.
66
(1)
(2)
(1)
(2)


