MetLife 2000 Annual Report Download - page 9
Download and view the complete annual report
Please find page 9 of the 2000 MetLife annual report below. You can navigate through the pages in the report by either clicking on the pages listed below, or by using the keyword search tool below to find specific information within the annual report.-
 1
1 -
 2
2 -
 3
3 -
 4
4 -
 5
5 -
 6
6 -
 7
7 -
 8
8 -
 9
9 -
 10
10 -
 11
11 -
 12
12 -
 13
13 -
 14
14 -
 15
15 -
 16
16 -
 17
17 -
 18
18 -
 19
19 -
 20
20 -
21
-
22
-
23
-
24
-
25
-
26
-
27
-
28
-
29
-
30
-
31
-
32
-
33
-
34
-
35
-
36
-
37
-
38
-
39
-
40
-
41
-
42
-
43
-
44
-
45
-
46
-
47
-
48
-
49
-
50
-
51
-
52
-
53
-
54
-
55
-
56
-
57
-
58
-
59
-
60
-
61
-
62
-
63
-
64
-
65
-
66
-
67
-
68
 |
 |
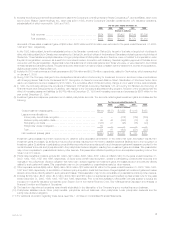
million to the variance. The increase of $885 million, or 51%, in Auto & Home is primarily due to the St. Paul acquisition, which represents $755 million of
the increase, as well as growth in this segment’s standard auto business. The increase of $137 million, or 26%, in International is primarily due to overall
growth in Mexico, Taiwan, South Korea, Spain and Brazil. The decrease in the Individual Business segment is primarily due to a decline in sales of
traditional life insurance policies, which reflects a continued shift in policyholders’ preferences from those policies to variable life products.
Universal life and investment-type product policy fees increased by $387 million, or 27%, to $1,820 million in 2000 from $1,433 million in 1999.
Excluding the impact of the GenAmerica acquisition, universal life and investment-type product policy fees increased by $145 million, or 10%. This
increase is almost entirely attributable to a $130 million, or 15%, increase in Individual Business, which is primarily due to increased sales, including
exchanges, of variable life products, increases in separate account assets and the acceleration of the recognition of unearned fees in connection with a
universal life product replacement program.
Net investment income increased by $1,952 million, or 20%, to $11,768 million in 2000 from $9,816 million in 1999. Excluding the impact of the
GenAmerica acquisition, net investment income increased by $832 million, or 8%. This increase is primarily due to higher income from (i) fixed maturities
of $653 million, or 9%, (ii) mortgage loans on real estate of $76 million, or 5%, (iii) interest on policy loans of $17 million, or 5%, (iv) cash and short term
investments of $79 million, or 46%, (v) real estate and real estate joint ventures, net of investment expenses and depreciation, of $45 million, or 8%, and
(vi) lower investment expenses of $27 million, or 10%. These increases are partially offset by reduced income from equity securities and other limited
partnership interests of $54 million, or 23%, and other invested assets of $11 million, or 12%.
The increase in income from fixed maturities to $7,824 million in 2000 from $7,171 million in 1999 is primarily due to higher volume in the securities
lending program and income from fixed maturities which were part of the St. Paul acquisition in the fourth quarter of 1999. These increases are partially
offset by decreases in income from equity-linked notes. The increase in income from mortgage loans on real estate to $1,560 million in 2000 from
$1,484 million in 1999 is largely due to higher mortgage production volume. The reduction in income from equity securities and other limited partnership
interests to $185 million in 2000 from $239 million in 1999 is predominantly the result of a decrease in sales by corporate partnerships.
Other revenues increased by $278 million, or 13%, to $2,432 million in 2000 from $2,154 million in 1999. The impact of the GenAmerica acquisition
is an increase to other revenues of $378 million. The variance year over year, excluding the impact of GenAmerica, is partially attributable to increases in
the Individual and Institutional Business segments. The increase of $89 million in Individual Business is largely a result of higher commission and fee
income related to increased sales in the broker/dealer and other subsidiaries. The primary driver of Institutional Business’ $36 million increase is strong
sales growth in its dental and disability administrative services businesses. Offsetting these increases is a $131 million decline in the Asset Management
segment due to the sale of Nvest, on October 30, 2000. The remaining variance is primarily due to the Corporate (including consolidation related
adjustments) segment.
The Company’s investment gains and losses are net of related policyholder amounts. The amounts netted against investment gains and losses are
(i) amortization of deferred policy acquisition costs attributable to the increase or decrease in product gross margins or profits resulting from investment
gains and losses, (ii) additional policyholder liabilities, which are required when investment gains are recognized and the Company reinvests the proceeds
in lower yielding assets (‘‘loss recognition’’), (iii) liabilities for those participating contracts in which the policyholders’ accounts are increased or decreased
by the related investment gains or losses, and (iv) adjustments to the policyholder dividend obligation resulting from investment gains and losses.
Net investment losses increased by $320 million, or 457%, to $390 million in 2000 from $70 million in 1999. This increase reflects total gross
investment losses of $444 million, an increase of $307 million, or 224%, from $137 million in 1999, before the offsets for: the amortization of deferred
policy acquisition costs of $95 million and $46 million in 2000 and 1999, respectively; changes in the policyholder dividend obligation of $85 million in
2000; and (additions to) or reductions in participating contracts of $(126) million and $21 million in 2000 and 1999, respectively, related to assets sold.
Excluding the impact of the GenAmerica acquisition, net investment losses increased by $378 million, or 540%. This increase reflects the continuation of
the Company’s strategy to reposition its investment portfolio in order to provide a higher operating return on its invested assets and the recognition of
losses through the proactive sale of certain assets. These losses are partially offset by a $663 million gain, which was recognized as a result of the sale of
Nvest on October 30, 2000.
The Company believes its policy of netting related policyholder amounts against investment gains and losses provides important information in
evaluating its operating performance. Investment gains and losses are often excluded by investors when evaluating the overall financial performance of
insurers. The Company believes its presentation enables readers of its consolidated statements of income to easily exclude investment gains and losses
and the related effects on the consolidated statements of income when evaluating its operating performance. The Company’s presentation of investment
gains and losses, net of policyholder amounts, may be different from the presentation used by other insurance companies and, therefore, amounts in its
consolidated statements of income may not be comparable with amounts reported by other insurers.
Policyholder benefits and claims increased by $3,793 million, or 29%, to $16,893 million in 2000 from $13,100 million in 1999. This increase
reflects total gross policyholder benefits and claims of $16,934 million, an increase of $3,855 million from $13,079 million in 1999, before the offsets for
additions to or (reductions in) participating contractholder accounts of $126 million in 2000 and $(21) million in 1999 and changes in the policyholder
dividend obligation of $(85) million in 2000 directly related to net investment losses. Excluding the impact of the GenAmerica acquisition, policyholder
benefits and claims increased $2,044 million, or 16%. This rise is primarily due to increases of $1,366 million, or 20%, in Institutional Business, $704
million, or 54%, in Auto & Home, and $104 million, or 23%, in International. These increases are partially offset by a decrease of $103 million, or 2%, in
Individual Business. The Institutional Business increase is largely due to overall growth within the segment’s group dental and disability businesses, as
well as the BMA and Lincoln National acquisitions. In addition, policyholder benefits and claims related to the group life and retirement and savings
businesses increased commensurate with the premium variance noted above. The increase in Auto & Home is due, in most part, to the St. Paul
acquisition, which represents $580 million of the increase. The remainder of the increase is largely attributable to a 9% increase in the number of auto
policies in force and increased costs resulting from an increase in the use of original equipment manufacturer parts and higher labor rates. The increase in
International is primarily due to overall growth in Mexico, Taiwan, South Korea, Spain and Brazil, commensurate with the increase in International’s
premiums. The decrease in Individual Business is predominately the result of improved mortality and morbidity experience.
Interest credited increased by $494 million, or 20%, to $2,935 million in 2000 from $2,441 million in 1999. Excluding the impact of the GenAmerica
acquisition, interest credited increased by $95 million, or 4%. This is primarily attributable to increases of $54 million, or 5%, in Institutional Business and
$36 million, or 3%, in Individual Business. The higher expense in Institutional Business is largely due to an increase in group insurance of $84 million,
which resulted from asset growth in customer account balances, growth in the bank-owned life insurance business and increases in the cash values of
executive and corporate-owned universal life plans. These increases are partially offset by a decrease in retirement and savings products of $30 million,
due to a continued shift in customers’ investment preferences from guaranteed interest products to separate account alternatives. The increase in
Individual Business is predominately due to higher policyholder account balances and increases in crediting rates on annuity and investment products.
MetLife, Inc.
6