MetLife 2000 Annual Report Download - page 15
Download and view the complete annual report
Please find page 15 of the 2000 MetLife annual report below. You can navigate through the pages in the report by either clicking on the pages listed below, or by using the keyword search tool below to find specific information within the annual report.-
 1
1 -
2
-
3
-
4
-
 5
5 -
 6
6 -
 7
7 -
 8
8 -
 9
9 -
 10
10 -
 11
11 -
 12
12 -
 13
13 -
 14
14 -
 15
15 -
 16
16 -
 17
17 -
 18
18 -
 19
19 -
 20
20 -
 21
21 -
 22
22 -
 23
23 -
 24
24 -
 25
25 -
26
-
27
-
28
-
29
-
30
-
31
-
32
-
33
-
34
-
35
-
36
-
37
-
38
-
39
-
40
-
41
-
42
-
43
-
44
-
45
-
46
-
47
-
48
-
49
-
50
-
51
-
52
-
53
-
54
-
55
-
56
-
57
-
58
-
59
-
60
-
61
-
62
-
63
-
64
-
65
-
66
-
67
-
68
 |
 |
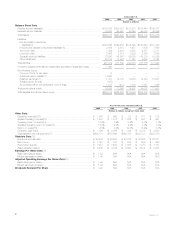
Year ended December 31, 1999 compared with the year ended December 31, 1998
Premiums increased by 7% to $5,525 million in 1999 from $5,159 million in 1998. Group insurance premiums increased by $478 million, or 10%, to
$5,095 million in 1999 from $4,617 million in 1998. This increase is largely attributable to strong sales and improved policyholder retention in non-medical
health, primarily the dental and disability businesses. Retirement and savings premiums decreased by $112 million, or 21%, to $430 million in 1999 from
$542 million in 1998, primarily due to premiums received from several large existing customers in 1998.
Universal life and investment-type product policy fees increased by 6% to $502 million in 1999 from $475 million in 1998. This increase reflects the
continued growth in the sale of products used in executive- and corporate-owned benefit plans due to the continued favorable tax status associated with
these products.
Other revenues increased by 9% to $629 million in 1999 from $575 million in 1998. Group life decreased by $51 million, or 77%, to $15 million in
1999 from $66 million in 1998. This decrease is primarily due to lower income in 1999 relating to funds used to seed separate accounts. Non-medical
health increased by $61 million, or 27%, to $287 million in 1999 from $226 million in 1998. This increase is primarily due to growth in the dental
administrative service business. Retirement and savings increased by $44 million, or 16%, to $327 million in 1999 from $283 million in 1998. This
increase reflects higher administrative fees derived from separate accounts and defined contribution record-keeping services. In addition, the 1999
results reflect interest on funds held on deposit relating to a reinsurance transaction entered into during December 1998.
Policyholder benefits and claims increased by 5% to $6,712 million in 1999 from $6,416 million in 1998. Group insurance increased by $362 million,
or 8%, to $4,857 million in 1999 from $4,495 million in 1998. This increase is primarily due to overall growth and is comparable to the growth in premiums
discussed above. Retirement and savings decreased by $66 million, or 3%, to $1,855 million in 1999 from $1,921 million in 1998. The decrease is
commensurate with the premium variance discussed above, partially offset by an increase in liabilities associated with the continued accumulation of
interest on liabilities relating to this segment’s large block of non-participating annuity business.
Interest credited to policyholder account balances decreased by 14% to $1,030 million in 1999 from $1,199 million in 1998. Group insurance
decreased by $63 million, or 14%, to $398 million in 1999 from $461 million in 1998. This decrease is primarily due to cancellations in the leveraged
corporate-owned life insurance business attributable to a change in the federal income tax treatment for these products. Retirement and savings
decreased by $106 million, or 14%, to $632 million in 1999 from $738 million in 1998 due to a shift in customers’ investment preferences from
guaranteed interest products to separate account alternatives and the continuation of the low interest rate environment.
Policyholder dividends increased by 12% to $159 million in 1999 from $142 million in 1998. Non-medical health increased by $26 million to $27
million in 1999. Group life and retirement and savings decreased $9 million, or 6%, to $132 million in 1999 from $141 million in 1998. Policyholder
dividends vary from period to period based on participating group insurance contract experience.
Other expenses decreased by 1% to $1,589 million in 1999 from $1,613 million in 1998. Other expenses related to group life decreased by $14
million, or 4%, to $382 million in 1999 from $396 million in 1998. Other expenses related to non-medical health decreased by $18 million, or 3%, to $673
million in 1999 from $691 million in 1998. These decreases are primarily attributable to reductions in non-sales positions and the achievement of
operational efficiencies. Other expenses related to retirement and savings products increased by $8 million, or 2%, to $534 million in 1999 from $526
million in 1998. This increase is due to higher interest expense of $47 million primarily due to commercial paper issued in connection with amounts
placed on deposit related to a 1998 reinsurance transaction and a $15 million increase in volume-related expenses, including premium taxes, separate
account investment management expenses and commissions. These increases are partially offset by a $54 million decrease due to reductions in non-
sales positions and other administrative expenses.
Reinsurance
Year ended December 31, 2000
As a result of the acquisition of GenAmerica, MetLife beneficially owns approximately 59% of RGA. MetLife’s Reinsurance segment is comprised of
the life reinsurance business of RGA, and MetLife’s ancillary life reinsurance business. The ancillary life reinsurance business was an immaterial
component of MetLife’s Individual Business segment for periods prior to January 1, 2000.
Revenues were $1,856 million for the year ended December 31, 2000. Reinsurance revenues are primarily derived from renewal premiums from
existing reinsurance treaties, new business premiums from existing or new reinsurance treaties and income earned on invested assets. Premium levels
are significantly influenced by large transactions and reporting practices of ceding companies and, as a result, can fluctuate from period to period.
Expenses were $1,672 million for the year ended December 31, 2000. Policy benefits and claims were 75.6% of premiums for the year ended
December 31, 2000, which is consistent with management’s expectations. Underwriting, acquisition and insurance expenses, which are included in
other expenses, were 22.3% of premiums for the year ended December 31, 2000. This percentage fluctuates depending on the mix of the underlying
insurance products being reinsured. Interest credited to policyholder account balances are related to amounts credited on RGA’s deposit-type contracts
and cash value products, which have a significant mortality component. This amount fluctuates with the changes in cash values and changes in interest
crediting rates.
Minority interest, which represents third-party ownership interests in RGA, was $67 million for the year ended December 31, 2000.
Auto & Home
Year ended December 31, 2000 compared with the year ended December 31, 1999
Premiums increased by $885 million, or 51%, to $2,636 million in 2000 from $1,751 million in 1999, primarily due to the St. Paul acquisition in 1999.
Excluding the impact of the St. Paul acquisition, premiums increased by $130 million, or 9%. Auto premiums increased by $95 million, or 8%, to $1,313
million in 2000 from $1,218 million in 1999. This increase is primarily due to growth in the standard auto insurance book of business, which was
attributable to increased new business production resulting from an increase in independent agents in this segment’s sales force and improved retention
in the existing business. Policyholder retention in the standard auto business increased by 1% to 89%. Homeowner premiums increased by $27 million,
or 11%, to $282 million in 2000 from $255 million in 1999 due to higher new business production as a result of a larger sales force and an increase in
policyholder retention of 2% to 91% in 2000 from 89% in 1999. Premiums from other personal lines increased by 44% to $26 million in 2000 from $18
million in 1999.
Other revenues increased by $19 million, or 90%, to $40 million in 2000 from $21 million in 1999, primarily due to a revision of an estimate of
amounts recoverable from reinsurers related to the disposition of this segment’s reinsurance business in 1990.
Expenses increased by $1,017 million, or 56%, to $2,832 million in 2000 from $1,815 million in 1999. Excluding the impact of the St. Paul
acquisition, expenses increased by $152 million, or 10%, which resulted in an increase in the combined ratio to 103.9% in 2000 from 102.8% in 1999.
As discussed below, higher overall loss costs, predominately in the homeowners line, is the primary cause of this increase.
MetLife, Inc.
12