MetLife 2000 Annual Report Download - page 5
Download and view the complete annual report
Please find page 5 of the 2000 MetLife annual report below. You can navigate through the pages in the report by either clicking on the pages listed below, or by using the keyword search tool below to find specific information within the annual report.-
 1
1 -
 2
2 -
 3
3 -
 4
4 -
 5
5 -
 6
6 -
 7
7 -
 8
8 -
 9
9 -
 10
10 -
 11
11 -
 12
12 -
 13
13 -
 14
14 -
 15
15 -
 16
16 -
17
-
18
-
19
-
20
-
21
-
22
-
23
-
24
-
25
-
26
-
27
-
28
-
29
-
30
-
31
-
32
-
33
-
34
-
35
-
36
-
37
-
38
-
39
-
40
-
41
-
42
-
43
-
44
-
45
-
46
-
47
-
48
-
49
-
50
-
51
-
52
-
53
-
54
-
55
-
56
-
57
-
58
-
59
-
60
-
61
-
62
-
63
-
64
-
65
-
66
-
67
-
68
 |
 |

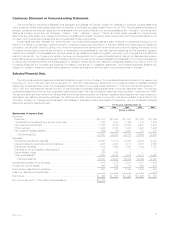
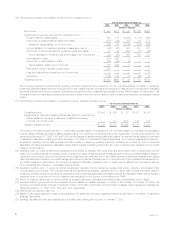
At December 31,
2000 1999 1998 1997 1996
(Dollars in millions)
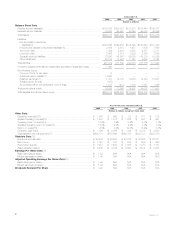
Balance Sheet Data
General account assets(4)************************************************** $184,768 $160,291 $157,278 $154,444 $145,877
Separate account assets*************************************************** 70,250 64,941 58,068 48,338 43,399
Total assets ************************************************************** $255,018 $225,232 $215,346 $202,782 $189,276
Liabilities:
Life and health policyholder
liabilities(10) ********************************************************** $140,896 $122,637 $122,726 $125,849 $121,333
Property and casualty policyholder liabilities(10) ****************************** 2,559 2,318 1,477 1,509 1,562
Short-term debt ******************************************************** 1,094 4,208 3,585 4,587 3,311
Long-term debt********************************************************* 2,426 2,514 2,903 2,884 1,946
Separate account liabilities *********************************************** 70,250 64,941 58,068 48,338 43,399
Other liabilities(4) ******************************************************** 20,314 14,924 11,720 5,608 5,742
Total liabilities************************************************************* 237,539 211,542 200,479 188,775 177,293
Company-obligated mandatorily redeemable securities of subsidiary trusts********** 1,090 ————
Stockholders’ Equity:
Common Stock, at par value ********************************************* 8————
Additional paid-in capital(11) ********************************************** 14,926 ————
Retained earnings(11)**************************************************** 1,021 14,100 13,483 12,140 10,937
Treasury stock, at cost*************************************************** (613) ————
Accumulated other comprehensive income (loss)***************************** 1,047 (410) 1,384 1,867 1,046
Total stockholders’ equity*************************************************** 16,389 13,690 14,867 14,007 11,983
Total liabilities and stockholders’ equity *************************************** $255,018 $225,232 $215,346 $202,782 $189,276
At or for the years ended December 31,
2000 1999 1998 1997 1996
(Dollars in millions, except per share data)
Other Data
Operating income(5)(12)******************************************** $ 1,541 $ 990 $ 23 $ 617 $ 818
Adjusted operating income(5)(13) ************************************** $ 1,541 $ 1,307 $ 1,226 $ 807 $ 921
Operating return on equity(14)*************************************** 10.5% 7.2% 0.2% 5.3% 7.8%
Adjusted operating return on equity(15) ******************************* 10.5% 9.5% 9.6% 7.0% 8.8%
Return on equity(16)*********************************************** 6.5% 4.5% 10.5% 10.4% 8.1%
Operating cash flows ********************************************** $ 1,326 $ 3,865 $ 842 $ 2,872 $ 3,688
Total assets under management(17)********************************** $302,181 $373,646 $360,703 $338,731 $297,570
Statutory Data(18)
Premiums and deposits ******************************************** $ 23,536 $ 24,643 $ 22,722 $ 20,569 $ 20,611
Net income ****************************************************** $ 1,027 $ 790 $ 875 $ 589 $ 460
Policyholder surplus *********************************************** $ 7,213 $ 7,630 $ 7,388 $ 7,378 $ 7,151
Asset valuation reserve ******************************************** $ 3,205 $ 3,109 $ 3,323 $ 3,814 $ 2,635
Earnings Per Share Data(19)
Basic earnings per share ******************************************* $ 1.52 N/A N/A N/A N/A
Diluted earnings per share****************************************** $ 1.49 N/A N/A N/A N/A
Adjusted Operating Earnings Per Share Data(20)
Basic earnings per share ******************************************* $ 1.99 N/A N/A N/A N/A
Diluted earnings per share****************************************** $ 1.96 N/A N/A N/A N/A
Dividends Declared Per Share ************************************* $ 0.20 N/A N/A N/A N/A
MetLife, Inc.
2