MetLife 2000 Annual Report Download - page 16
Download and view the complete annual report
Please find page 16 of the 2000 MetLife annual report below. You can navigate through the pages in the report by either clicking on the pages listed below, or by using the keyword search tool below to find specific information within the annual report.-
 1
1 -
2
-
3
-
4
-
5
-
 6
6 -
 7
7 -
 8
8 -
 9
9 -
 10
10 -
 11
11 -
 12
12 -
 13
13 -
 14
14 -
 15
15 -
 16
16 -
 17
17 -
 18
18 -
 19
19 -
 20
20 -
 21
21 -
 22
22 -
 23
23 -
 24
24 -
 25
25 -
 26
26 -
27
-
28
-
29
-
30
-
31
-
32
-
33
-
34
-
35
-
36
-
37
-
38
-
39
-
40
-
41
-
42
-
43
-
44
-
45
-
46
-
47
-
48
-
49
-
50
-
51
-
52
-
53
-
54
-
55
-
56
-
57
-
58
-
59
-
60
-
61
-
62
-
63
-
64
-
65
-
66
-
67
-
68
 |
 |
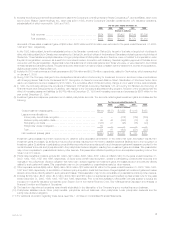
Policyholder benefits and claims increased by $704 million, or 54%, to $2,005 million in 2000 from $1,301 million in 1999. Automobile policyholder
benefits and claims increased by $438 million, or 42%, to $1,490 million in 2000 from $1,052 million in 1999. Homeowner policyholder benefits and
claims increased by $260 million, or 112%, to $493 million in 2000 from $233 million in 1999. Other policyholder benefits and claims increased by $6
million, or 38%, to $22 million in 2000 from $16 million in 1999. Correspondingly, the auto loss ratio increased to 76.6% in 2000 from 76.1% in 1999 and
the homeowners loss ratio increased to 76.4% from 67.2% in 1999. The increase in the homeowners loss ratio is primarily due to higher catastrophe
losses and expenses, predominantly in the St. Paul book of business. Catastrophes, including multiple storms and the Los Alamos fire, resulted in an
increase in the catastrophe loss ratio to 17.3% in 2000 from 6.3% in 1999.
Excluding the impact of the St. Paul acquisition, policyholder benefits and claims increased by $124 million, or 11%. Auto policyholder benefits and
claims increased by $102 million, or 11%, to $1,041 million in 2000 from $939 million in 1999. This is largely attributable to a 9% increase in the number
of policies in force and increased costs resulting from an increase in the use of original equipment manufacturer parts and higher labor rates. The auto
loss ratio increased to 79.3% in 2000 from 77.1% in 1999. Homeowners benefits and claims increased by $23 million, or 14%, to $186 million in 2000
from $163 million in 1999, primarily due to the increased volume of this book of business and increased catastrophe experience as discussed above.
The homeowners loss ratio increased by 1.6% to 66.0% in 2000 from 64.4% in 1999. Other personal lines benefits and claims decreased by $1 million
to $11 million in 2000 from $12 million in 1999.
Other expenses increased by $313 million, or 61%, to $827 million in 2000 from $514 million in 1999, which resulted in an increase in the expense
ratio to 31.4% in 2000 from 29.3% in 1999. A portion of the increase in expenses from 1999 to 2000 is associated with the costs incurred in connection
with the integration of the St. Paul business acquired.
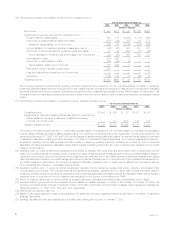
Year ended December 31, 1999 compared with the year ended December 31, 1998
Premiums increased by 25% to $1,751 million in 1999 from $1,403 million in 1998 primarily due to the St. Paul acquisition in 1999. Excluding the
impact of the St. Paul acquisition, premiums increased by $88 million, or 6%. Auto premiums increased by $54 million, or 5%, to $1,218 million in 1999
from $1,164 million in 1998. This increase is due to growth in both the standard and non-standard auto insurance books of business. ‘‘Non-standard’’
auto insurance is insurance for risks bearing higher loss experience or loss potential than risks covered by standard auto insurance policies. In addition,
the standard auto policyholder retention increased 1% to 88%. Homeowner premiums increased by $30 million, or 13%, to $255 million in 1999 from
$225 million in 1998 due to higher new business production, an average premium increase of 1%, and increased policyholder retention to 90% in 1999
from 89% in 1998. Premiums from other personal lines increased to $18 million in 1999 from $14 million in 1998.
Other revenues decreased by 42% to $21 million in 1999 from $36 million in 1998. This decrease is primarily attributable to a decrease in payments
resulting from experience-related adjustments under a reinsurance agreement related to the disposition of this segment’s reinsurance business in 1990.
Expenses increased by 28% to $1,815 million in 1999 from $1,415 million in 1998. This resulted in an increase in the combined ratio to 103.7% in
1999 from 100.8% in 1998. Excluding the impact of the St. Paul acquisition, expenses increased by $116 million, or 8%, which resulted in an increase in
the combined ratio to 102.8% in 1999 from 100.8% in 1998. This increase is primarily due to higher overall loss costs in the auto and homeowners lines
as discussed below. In addition, both lines experienced modestly elevated acquisition expenses due to increased levels of new business premiums.
Policyholder benefits and claims increased by 26% to $1,301 million in 1999 from $1,029 million in 1998. Correspondingly, the auto and
homeowners loss ratios increased to 76.1% from 74.9% and to 67.2% from 65.0% in 1999 and 1998, respectively. Excluding the impact of the St. Paul
acquisition, policyholder benefits and claims increased by $85 million, or 8%. Auto policyholder benefits and claims increased by $67 million, or 8%, to
$939 million in 1999 from $872 million in 1998, due to a 6% increase in the number of policies in-force and $23 million of unfavorable claims
development due to lower than expected savings resulting from the implementation of a new technology platform. Correspondingly, the auto loss ratio
increased to 77.1% in 1999 from 74.9% in 1998. Homeowners benefits and claims increased by $17 million, or 12%, to $163 million in 1999 from $146
million in 1998 due to increased volume of this book of business. The homeowners loss ratio decreased by 0.6% to 64.4% in 1999 from 65.0% in 1998.
Other personal lines benefits and claims increased by $1 million to $12 million in 1999 from $11 million in 1998.
Other expenses increased by 33% to $514 million in 1999 from $386 million in 1998, which resulted in an increase in the expense ratio to 29.3% in
1999 from 27.4% in 1998. Excluding the impact of the St. Paul acquisition, operating expenses increased by $31 million, or 8%, resulting in an increase
in the expense ratio to 27.9% in 1999 from 27.4% in 1998. This increase is primarily due to $10 million in additional administration expenses and $23
million in new business acquisition expenses, which are partially offset by a reduction in employee-related expenses.
Asset Management
Year ended December 31, 2000 compared with the year ended December 31, 1999
Other revenues, which are primarily comprised of management and advisory fees, decreased by $43 million, or 5%, to $760 million in 2000 from
$803 million in 1999. The most significant factor contributing to this decline is a $131 million decrease resulting primarily from the sale of Nvest, which
occurred on October 30, 2000. This reduction is partially offset by a $79 million increase related to the acquisition of Conning, a component of the
GenAmerica acquisition. Excluding the impact of these transactions, other revenues increased by $9 million, or 6%, to $159 million in 2000 from $150
million in 1999. This is attributable to an increase in average assets under management during the year and a change in asset mix. Despite a $1 billion, or
2%, decrease in assets under management from $57 billion as of December 31, 1999 to $56 billion at December 31, 2000, average assets under
management exceed those for the same period in 1999. The decline occurred during the fourth quarter as a result of a market downturn. Management
and advisory fees are typically calculated based on a percentage of assets under management, and are not necessarily proportionate to average assets
managed due to changes in account mix.
Other expenses increased by $8 million, or 1%, to $749 million in 2000 from $741 million in 1999. The sale of Nvest reduced other expenses by
$92 million and the acquisition of Conning increased other expenses by $90 million. Excluding the impact of these transactions, other expenses
increased by $10 million, or 5%, to $202 million in 2000 from $192 million in 1999. Approximately half of the variance is attributable to an increase in total
compensation and benefits. This expense totaled $103 million for the year 2000 and is comprised of approximately 59% base compensation and 41%
variable compensation. Base compensation increased by $2 million, or 3%, to $61 million in 2000 from $59 million in 1999, primarily due to annual salary
increases and higher staffing levels. Variable compensation increased by $3 million, or 8%, to $42 million in 2000 from $39 million in 1999. Variable
incentive payments are based upon profitability, investment portfolio performance, new business sales and growth in revenues and profits. The variable
compensation plans reward the employees for growth in their businesses, but also require them to share in the impact of any declines. General
administrative expenses increased by $5 million, or 5%, to $99 million in 2000 from $94 million in 1999. This increase is primarily due to increased mutual
fund expense subsidies, distribution costs and system enhancements.
Minority interest, reflecting third-party ownership interest in Nvest, decreased by $19 million, or 35%, to $35 million in 2000 from $54 million in 1999.
MetLife, Inc. 13