MetLife 2000 Annual Report Download - page 17
Download and view the complete annual report
Please find page 17 of the 2000 MetLife annual report below. You can navigate through the pages in the report by either clicking on the pages listed below, or by using the keyword search tool below to find specific information within the annual report.-
 1
1 -
2
-
3
-
4
-
5
-
6
-
 7
7 -
 8
8 -
 9
9 -
 10
10 -
 11
11 -
 12
12 -
 13
13 -
 14
14 -
 15
15 -
 16
16 -
 17
17 -
 18
18 -
 19
19 -
 20
20 -
 21
21 -
 22
22 -
 23
23 -
 24
24 -
 25
25 -
 26
26 -
 27
27 -
28
-
29
-
30
-
31
-
32
-
33
-
34
-
35
-
36
-
37
-
38
-
39
-
40
-
41
-
42
-
43
-
44
-
45
-
46
-
47
-
48
-
49
-
50
-
51
-
52
-
53
-
54
-
55
-
56
-
57
-
58
-
59
-
60
-
61
-
62
-
63
-
64
-
65
-
66
-
67
-
68
 |
 |
Year ended December 31, 1999 compared with the year ended December 31, 1998
Other revenues, which are primarily comprised of management and advisory fees, decreased by $14 million, or 2%, to $803 million in 1999 from
$817 million in 1998, reflecting an overall decrease in assets under management of $1 billion, or 1%, to $190 billion at December 31, 1999 from
$191 billion at December 31, 1998. This decrease in assets is primarily attributable to a reduction in assets under management in value-style products.
Management and advisory fees are typically calculated based on a percentage of assets under management, and are not necessarily proportionate to
average assets managed due to changes in account mix.
Other expenses are essentially unchanged in 1999 from 1998. Total compensation and benefits of $424 million consisted of approximately 53%
base compensation and 47% variable compensation. Base compensation increased by $10 million, or 5%, to $225 million in 1999 from $215 million in
1998, primarily due to annual salary increases and higher staffing levels. Variable compensation decreased by $15 million, or 7%, to $199 million in 1999
from $214 million in 1998. Variable incentive payments are based upon profitability, investment portfolio performance, new business sales and growth in
revenues and profits. The variable compensation plans reward the employees for growth in their businesses, but also require them to share in the impact
of any declines. In addition, general and administrative expenses increased by $6 million, or 2%, to $317 million in 1999 from $311 million in 1998,
primarily due to increased discretionary spending.
Minority interest, reflecting third-party ownership interests in Nvest, decreased by $5 million, or 9%, to $54 million in 1999 from $59 million in 1998.
International
Year ended December 31, 2000 compared with the year ended December 31, 1999
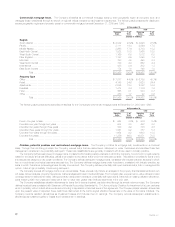
Premiums increased by $137 million, or 26%, to $660 million in 2000 from $523 million in 1999. Mexico’s premiums increased by $45 million,
primarily due to new business growth in the group life and major medical products. South Korea’s increase in premiums of $29 million is mainly
attributable to the establishment of a new professional agency force resulting in higher productivity levels and an improvement in the individual life
business’ persistency. The majority of Taiwan’s premium increase of $28 million is due to overall growth in the individual life business. Increased sales
from the direct auto business is the principal driver behind Spain’s premium increase of $18 million. Brazil’s premiums increased by $14 million resulting
predominately from business expansion. Brazil began selling business late in the second quarter of 1999 and acquired two large blocks of business in
the beginning of 2000. The remainder of the increase is due to minor increases in several other countries.
Universal life and investment-type product policy fees increased by $10 million, or 22%, to $53 million in 2000 from $43 million in 1999, primarily
due to expanded business operations in both Argentina and Spain.
Other revenues decreased by $3 million to $9 million in 2000 from $12 million in 1999. This decrease is attributable to variances in several countries.
Policyholder benefits and claims increased by $104 million, or 23%, to $562 million in 2000 from $458 million in 1999. Mexico, Taiwan, South Korea
and Brazil’s policyholder benefits and claims increased by $35 million, $32 million, $14 million and $8 million, respectively, commensurate with the overall
premium growth discussed above. Spain’s policyholder benefits and claims increased by $11 million, primarily due to increases in auto claims. This is
consistent with the premium growth discussed above. The remainder of the increase is primarily due to expanded business operations in several other
countries.
Interest credited to policyholder account balances increased by $4 million, or 8%, to $56 million in 2000 from $52 million in 1999 as a result of
growth in policyholder account balances in Argentina and Mexico.
Policyholder dividends increased by $10 million, or 47%, to $32 million in 2000 from $22 million in 1999. This increase is largely attributable to
growth in Mexico’s participating group business and is in line with the increase in premiums discussed above.
Payments of $327 million related to Metropolitan Life’s demutualization were made during the second quarter of 2000 to holders of certain policies
transferred to Clarica Life Insurance Company in connection with the sale of a substantial portion of the Company’s Canadian operations in 1998.
Other expenses increased by $44 million, or 18%, to $292 million in 2000 from $248 million in 1999. This increase is partially attributable to
business expansion initiatives in Brazil and Uruguay and the establishment of operations in Poland, the Philippines, and India in 2000. The remaining
increase in other expenses is commensurate with the overall growth discussed above.
Year ended December 31, 1999 compared with the year ended December 31, 1998
Premiums decreased by 15% to $523 million in 1999 from $618 million in 1998, primarily due to the disposition of a substantial portion of the
Company’s Canadian operations. Excluding the impact of this sale, premiums increased by $109 million, or 26%, to $523 million in 1999 from
$414 million in 1998. Argentina’s premiums increased by $11 million, primarily due to expanded business operations. South Korea’s and Taiwan’s
premiums increased by $24 million and $39 million, respectively, due to improved economic environments. Spain’s premiums increased by $24 million
primarily due to increased sales through the Company’s joint venture partnership.
Universal life and investment-type product policy fees decreased by 37% to $43 million in 1999 from $68 million in 1998. Excluding the impact of
the Canadian divestiture, universal life and investment-type product policy fees were essentially unchanged at $43 million in 1999 compared with $46
million in 1998.
Other revenues decreased by 64% to $12 million in 1999 from $33 million in 1998. Excluding the impact of the Canadian divestiture, other revenues
increased slightly to $12 million in 1999 from $10 million in 1998.
Policyholder benefits and claims decreased by 23% to $458 million in 1999 from $597 million in 1998. Excluding the impact of the Canadian
divestiture, policyholder benefits and claims increased by $101 million, or 28%, to $458 million in 1999 from $357 million in 1998. This increase is
commensurate with the aforementioned increase in premiums.
Interest credited to policyholder account balances decreased by 42% to $52 million in 1999 from $89 million in 1998. Excluding the impact of the
Canadian divestiture, interest credited to policyholder account balances increased by $1 million, or 2%, to $52 million in 1999 from $51 million in 1998 in
line with increased account balances.
Policyholder dividends decreased by 66% to $22 million in 1999 from $64 million in 1998. Excluding the impact of the Canadian divestiture,
policyholder dividends decreased $1 million, or 5%, to $22 million in 1999 from $21 million in 1998, primarily due to less favorable experience on
participating policies in Spain.
Other expenses decreased by 30% to $248 million in 1999 from $352 million in 1998. Excluding the impact of the Canadian divestiture, other
expenses decreased by $7 million, or 3%, to $248 million in 1999 from $255 million in 1998. This decrease is primarily attributable to ongoing cost
reduction initiatives.
MetLife, Inc.
14