MetLife 2000 Annual Report Download - page 65
Download and view the complete annual report
Please find page 65 of the 2000 MetLife annual report below. You can navigate through the pages in the report by either clicking on the pages listed below, or by using the keyword search tool below to find specific information within the annual report.-
 1
1 -
2
-
3
-
4
-
5
-
6
-
7
-
8
-
9
-
10
-
11
-
12
-
13
-
14
-
15
-
16
-
17
-
18
-
19
-
20
-
21
-
22
-
23
-
24
-
25
-
26
-
27
-
28
-
29
-
30
-
31
-
32
-
33
-
34
-
35
-
36
-
37
-
38
-
39
-
40
-
41
-
42
-
43
-
44
-
45
-
46
-
47
-
48
-
49
-
50
-
51
-
52
-
53
-
54
-
 55
55 -
 56
56 -
 57
57 -
 58
58 -
 59
59 -
 60
60 -
 61
61 -
 62
62 -
 63
63 -
 64
64 -
 65
65 -
 66
66 -
 67
67 -
 68
68
 |
 |

METLIFE, INC.
NOTES TO CONSOLIDATED FINANCIAL STATEMENTS — (Continued)
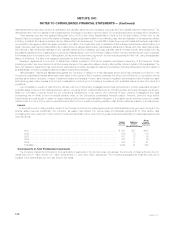
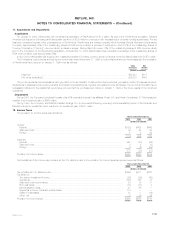
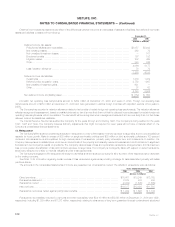
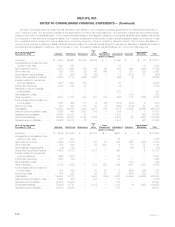
Set forth in the tables below is certain financial information with respect to the Company’s operating segments for the years ended December 31,
2000, 1999 and 1998. The accounting policies of the segments are the same as those described in the summary of significant accounting policies,
except for the method of capital allocation. The Company allocates capital to each segment based upon an internal capital allocation system that allows
the Company to more effectively manage its capital. The Company evaluates the performance of each operating segment based upon income or loss
from operations before provision for income taxes and non-recurring items (e.g. items of unusual or infrequent nature). The Company allocates non-
recurring items (primarily consisting of sales practices claims and claims for personal injuries caused by exposure to asbestos or asbestos-containing
products and demutualization costs) and, prior to its sale in 1998, the results of MetLife Capital Holdings, Inc., to the Corporate segment.
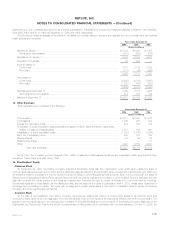
Auto
At or for the year ended & Asset Consolidation/
December 31, 2000 Individual Institutional Reinsurance Home Management International Corporate Elimination Total
(Dollars in millions)
Premiums *********************** $ 4,673 $6,900 $1,450 $2,636 $ — $ 660 $ — $ (2) $ 16,317
Universal life and investment-type
product policy fees ************* 1,221 547 — — — 53 — (1) 1,820
Net investment income************ 6,475 3,959 379 194 90 254 662 (245) 11,768
Other revenues ****************** 838 673 29 40 760 9 121 (38) 2,432
Net investment gains (losses) ****** 227 (475) (2) (20) — 18 (200) 62 (390)
Policyholder benefits and claims **** 5,054 8,178 1,096 2,005 — 562 (2) — 16,893
Interest credited to policyholder
account balances ************** 1,680 1,090 109 — — 56 — — 2,935
Policyholder dividends ************ 1,742 124 21 — — 32 — — 1,919
Payments to former Canadian
policyholders ****************** — — — — — 327 — — 327
Demutualization costs ************* — — — — — — 230 — 230
Other expenses****************** 3,511 1,753 513 827 784 292 773 (226) 8,227
Income (loss) before provision for
income taxes ****************** 1,447 459 117 18 66 (275) (418) 2 1,416
Net income (loss) **************** 920 307 69 30 34 (285) (146) 24 953
Total assets ********************* 132,433 90,279 7,280 4,511 418 5,119 18,542 (3,564) 255,018
Deferred policy acquisition costs **** 8,610 446 1,030 176 — 354 1 1 10,618
Separate account assets ********** 34,860 33,918 28 — — 1,491 — (47) 70,250
Policyholder liabilities ************** 84,049 50,223 5,145 2,559 — 2,435 24 (980) 143,455
Separate account liabilities ********* 34,860 33,918 28 — — 1,491 — (47) 70,250
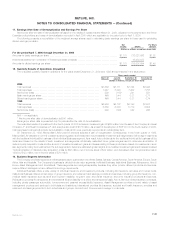
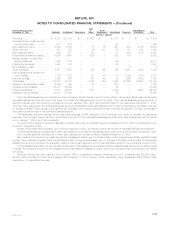
Auto
At or for the year ended & Asset Consolidation/
December 31, 1999 Individual Institutional Reinsurance Home Management International Corporate Elimination Total
(Dollars in millions)
Premiums *********************** $ 4,289 $ 5,525 $ — $1,751 $— $523 $ — $ — $ 12,088
Universal life and investment-type
product policy fees ************* 888 502 — — — 43 — — 1,433
Net investment income************ 5,346 3,755 — 103 80 206 605 (279) 9,816
Other revenues ****************** 558 629 — 21 803 12 59 72 2,154
Net investment (losses) gains ****** (14) (31) — 1 — 1 (41) 14 (70)
Policyholder benefits and claims **** 4,625 6,712 — 1,301 — 458 — 4 13,100
Interest credited to policyholder
account balances ************** 1,359 1,030 — — — 52 — — 2,441
Policyholder dividends ************ 1,509 159 — — — 22 — — 1,690
Demutualization costs ************* — — — — — — 260 — 260
Other expenses****************** 2,719 1,589 — 514 795 248 1,031 (141) 6,755
Income (loss) before provision for
income taxes ****************** 855 890 — 61 88 5 (668) (56) 1,175
Net income (loss) **************** 555 567 — 56 51 21 (583) (50) 617
Total assets ********************* 109,401 88,127 — 4,443 1,036 4,381 20,499 (2,655) 225,232
Deferred policy acquisition costs **** 8,228 364 — 167 — 311 — — 9,070
Separate account assets ********** 28,828 35,236 — — — 877 — — 64,941
Policyholder liabilities ************** 72,956 47,781 — 2,318 — 2,187 6 (293) 124,955
Separate account liabilities ********* 28,828 35,236 — — — 877 — — 64,941
MetLife, Inc.
F-34