MetLife 2000 Annual Report Download - page 7
Download and view the complete annual report
Please find page 7 of the 2000 MetLife annual report below. You can navigate through the pages in the report by either clicking on the pages listed below, or by using the keyword search tool below to find specific information within the annual report.-
 1
1 -
 2
2 -
 3
3 -
 4
4 -
 5
5 -
 6
6 -
 7
7 -
 8
8 -
 9
9 -
 10
10 -
 11
11 -
 12
12 -
 13
13 -
 14
14 -
 15
15 -
 16
16 -
 17
17 -
 18
18 -
19
-
20
-
21
-
22
-
23
-
24
-
25
-
26
-
27
-
28
-
29
-
30
-
31
-
32
-
33
-
34
-
35
-
36
-
37
-
38
-
39
-
40
-
41
-
42
-
43
-
44
-
45
-
46
-
47
-
48
-
49
-
50
-
51
-
52
-
53
-
54
-
55
-
56
-
57
-
58
-
59
-
60
-
61
-
62
-
63
-
64
-
65
-
66
-
67
-
68
 |
 |

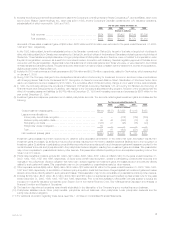
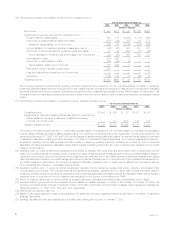
(12) The following provides a reconciliation of net income to operating income:
For the years ended December 31,
2000 1999 1998 1997 1996
(Dollars in millions)
Net income ******************************************************** $ 953 $617 $ 1,343 $ 1,203 $ 853
Adjustments to reconcile net income to operating income:
Gross investment losses (gains) ************************************* 444 137 (2,629) (1,018) (458)
Income tax on gross investment gains and losses ********************** (175) (92) 883 312 173
Investment losses (gains), net of income tax************************* 269 45 (1,746) (706) (285)
Amount allocated to investment gains and losses (see note 5) *********** (54) (67) 608 231 227
Income tax on amount allocated to investment gains and losses********** 21 45 (204) (71) (86)
Amount allocated to investment gains and losses, net of income tax **** (33) (22) 404 160 141
Demutualization costs********************************************** 230 260 6 — —
Income tax on demutualization costs ********************************* (60) (35) (2) — —
Demutualization costs, net of income tax *************************** 170 225 4 — —
Payments to former Canadian policyholders *************************** 327 — — — —
Loss from discontinued operations, net of income tax******************* ————71
Surplus tax ****************************************************** (145) 125 18 (40) 38
Operating income *************************************************** $1,541 $990 $ 23 $ 617 $ 818
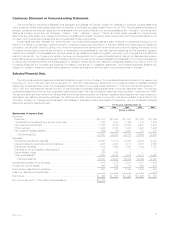
The Company believes the supplemental operating information presented above allows for a more complete analysis of results of operations.
Investment gains and losses have been excluded due to their volatility between periods and because such data are often excluded when evaluating
the overall financial performance of insurers. Operating income should not be considered as a substitute for any GAAP measure of performance. The
Company’s method of calculating operating income may be different from the method used by other companies and therefore comparability may be
limited.
(13) The following provides a reconciliation of operating income to adjusted operating income:
For the years ended December 31,
2000 1999 1998 1997 1996
(Dollars in millions)
Operating income *********************************************** $1,541 $ 990 $ 23 $ 617 $ 818
Adjustments for charges for sales practices claims and for personal injury
claims caused by exposure to asbestos or asbestos-containing
products, net of income tax************************************* — 317 1,203 190 103
Adjusted operating income *************************************** $1,541 $1,307 $1,226 $ 807 $ 921
The charge for the year ended December 31, 1999 was principally related to the settlement of a multidistrict litigation proceeding involving alleged
improper sales practices, accruals for sales practices claims not covered by the settlement and other legal costs. The amounts reported for the
years ended December 31, 1998, 1997 and 1996 include charges for sales practices claims and claims for personal injuries caused by exposure
to asbestos or asbestos-containing products. See Note 10 of Notes to Consolidated Financial Statements. The Company believes that supplemen-
tal adjusted operating income data provides information useful in measuring operating trends by excluding the unusual amounts of expenses
associated with sales practices and asbestos-related claims. Adjusted operating income should not be considered as a substitute for any GAAP
measure of performance.
(14) Operating return on equity is defined as operating income divided by average total equity excluding accumulated other comprehensive income
(loss). The Company believes the operating return on equity information presented supplementally allows for a more complete analysis of results of
operations. Accumulated other comprehensive income (loss) has been excluded due to its volatility between periods and because such data is
often excluded when evaluating the overall financial performance of insurers. Operating return on equity should not be considered as a substitute for
any GAAP measure of performance. The Company’s method of calculating operating return on equity may be different from the method used by
other companies and, therefore, comparability may be limited.
(15) Adjusted operating return on equity is defined as adjusted operating income divided by average total equity, excluding accumulated other
comprehensive income (loss). The Company believes that supplemental adjusted operating return on equity data provides information useful in
measuring operating trends by excluding the unusual amounts of expenses associated with sales practices and asbestos-related claims. Adjusted
operating return on equity should not be considered as a substitute for net income in accordance with GAAP.
(16) Return on equity is defined as net income divided by average total equity, excluding accumulated other comprehensive income (loss).
(17) Includes MetLife’s general account and separate account assets and assets managed on behalf of third parties. On October 30, 2000, the
Company completed its sale of Nvest. Includes $133 billion, $135 billion, $125 billion and $100 billion of assets under management managed by
Nvest at December 31, 1999, 1998, 1997 and 1996, respectively.
(18) Metropolitan Life statutory data only.
(19) Based on earnings subsequent to date of demutualization. For additional information regarding these items, see Note 17 of Notes to Consolidated
Financial Statements.
(20) Earnings per share amounts are presented as if the initial public offering had occurred on January 1, 2000.
MetLife, Inc.
4