MetLife 2000 Annual Report Download - page 45
Download and view the complete annual report
Please find page 45 of the 2000 MetLife annual report below. You can navigate through the pages in the report by either clicking on the pages listed below, or by using the keyword search tool below to find specific information within the annual report.-
 1
1 -
2
-
3
-
4
-
5
-
6
-
7
-
8
-
9
-
10
-
11
-
12
-
13
-
14
-
15
-
16
-
17
-
18
-
19
-
20
-
21
-
22
-
23
-
24
-
25
-
26
-
27
-
28
-
29
-
30
-
31
-
32
-
33
-
34
-
 35
35 -
 36
36 -
 37
37 -
 38
38 -
 39
39 -
 40
40 -
 41
41 -
 42
42 -
 43
43 -
 44
44 -
 45
45 -
 46
46 -
 47
47 -
 48
48 -
 49
49 -
 50
50 -
 51
51 -
 52
52 -
 53
53 -
 54
54 -
 55
55 -
56
-
57
-
58
-
59
-
60
-
61
-
62
-
63
-
64
-
65
-
66
-
67
-
68
 |
 |

METLIFE, INC.
NOTES TO CONSOLIDATED FINANCIAL STATEMENTS — (Continued)
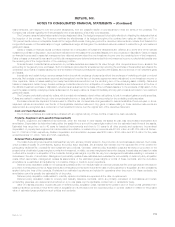
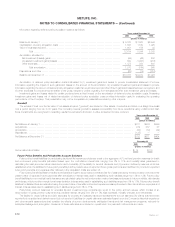
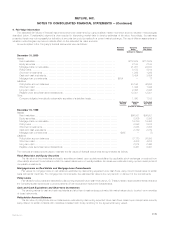
The cost or amortized cost and estimated fair value of bonds at December 31, 2000, by contractual maturity date, are shown below:
Cost or
Amortized Estimated
Cost Fair Value
(Dollars in millions)
Due in one year or less *************************************************************** $ 3,465 $ 3,460
Due after one year through five years **************************************************** 21,041 21,275
Due after five years through ten years**************************************************** 23,872 23,948
Due after ten years ******************************************************************* 29,564 30,402
Total *********************************************************************** 77,942 79,085
Mortgage- and asset-backed securities ************************************************** 33,039 33,573
Total bonds ***************************************************************** $110,981 $112,658
Bonds not due at a single maturity date have been included in the above table in the year of final maturity. Actual maturities may differ from
contractual maturities due to the exercise of prepayment options.
Sales of securities classified as available-for-sale were as follows:
Years ended December 31,
2000 1999 1998
(Dollars in millions)
Proceeds ****************************************************************************** $46,205 $59,852 $46,913
Gross investment gains ****************************************************************** $ 599 $ 605 $ 2,053
Gross investment losses ***************************************************************** $ 1,520 $ 911 $ 486
Gross investment losses above exclude writedowns recorded during 2000 and 1999 for permanently impaired available-for-sale securities of $324
million and $133 million, respectively.
Excluding investments in U.S. Treasury securities and obligations of U.S. government corporations and agencies, the Company is not exposed to
any significant concentration of credit risk in its fixed maturities portfolio.
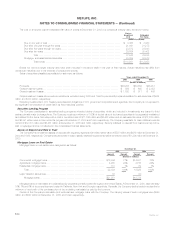
Securities Lending Program
The Company participates in securities lending programs whereby blocks of securities, which are included in investments, are loaned to third
parties, primarily major brokerage firms. The Company requires a minimum of 102% of the fair value of the loaned securities to be separately maintained
as collateral for the loans. Securities with a cost or amortized cost of $11,746 million and $6,458 million and an estimated fair value of $12,289 million
and $6,391 million were on loan under the program at December 31, 2000 and 1999, respectively. The Company was liable for cash collateral under its
control of $12,301 million and $6,461 million at December 31, 2000 and 1999, respectively. Security collateral on deposit from customers may not be
sold or repledged and is not reflected in the consolidated financial statements.
Assets on Deposit and Held in Trust
The Company had investment assets on deposit with regulatory agencies with a fair market value of $597 million and $476 million at December 31,
2000 and 1999, respectively. Company securities held in trust to satisfy collateral requirements had an amortized cost of $1,234 million at December 31,
2000.
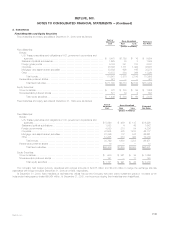
Mortgage Loans on Real Estate
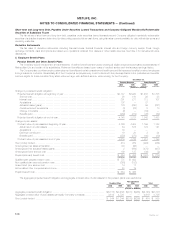
Mortgage loans on real estate were categorized as follows:
December 31,
2000 1999
Amount Percent Amount Percent
(Dollars in millions)
Commercial mortgage loans************************************************** $16,944 77% $14,931 75%
Agricultural mortgage loans*************************************************** 4,980 22% 4,816 24%
Residential mortgage loans*************************************************** 110 1% 82 1%
Total****************************************************************** 22,034 100% 19,829 100%
Less: Valuation allowances *************************************************** 83 90
Mortgage loans ******************************************************** $21,951 $19,739
Mortgage loans on real estate are collateralized by properties primarily located throughout the United States. At December 31, 2000, approximately
16%, 7% and 6% of the properties were located in California, New York and Georgia, respectively. Generally, the Company (as the lender) requires that a
minimum of one-fourth of the purchase price of the underlying real estate be paid by the borrower.
Certain of the Company’s real estate joint ventures have mortgage loans with the Company. The carrying values of such mortgages were $540
million and $547 million at December 31, 2000 and 1999, respectively.
MetLife, Inc.
F-14