MetLife 2000 Annual Report Download - page 13
Download and view the complete annual report
Please find page 13 of the 2000 MetLife annual report below. You can navigate through the pages in the report by either clicking on the pages listed below, or by using the keyword search tool below to find specific information within the annual report.-
 1
1 -
2
-
 3
3 -
 4
4 -
 5
5 -
 6
6 -
 7
7 -
 8
8 -
 9
9 -
 10
10 -
 11
11 -
 12
12 -
 13
13 -
 14
14 -
 15
15 -
 16
16 -
 17
17 -
 18
18 -
 19
19 -
 20
20 -
 21
21 -
 22
22 -
 23
23 -
24
-
25
-
26
-
27
-
28
-
29
-
30
-
31
-
32
-
33
-
34
-
35
-
36
-
37
-
38
-
39
-
40
-
41
-
42
-
43
-
44
-
45
-
46
-
47
-
48
-
49
-
50
-
51
-
52
-
53
-
54
-
55
-
56
-
57
-
58
-
59
-
60
-
61
-
62
-
63
-
64
-
65
-
66
-
67
-
68
 |
 |
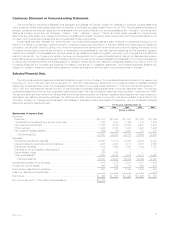
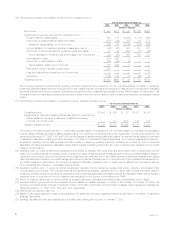
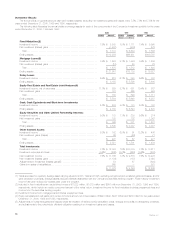
reflects the acceleration of the recognition of unearned fees in connection with a product replacement program related to universal life policies. Policy
fees from annuity and investment products increased by $82 million, or 26%, to $399 million in 2000 from $317 million in 1999, primarily due to
continued growth in separate account assets.
Other revenues increased by $280 million, or 50%, to $838 million in 2000 from $558 million in 1999. Excluding the impact of the GenAmerica
acquisition, other revenues increased by $89 million, or 16%. Other revenues for insurance products increased by $91 million, or 17%, to $612 million in
2000 from $521 million in 1999. This increase is principally attributable to higher commission and fee income associated with increased sales in the
broker/dealer and other subsidiaries. Other revenues for annuity products remained essentially unchanged at $35 million in 2000 compared with $37
million in 1999.
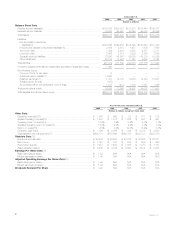
Policyholder benefits and claims increased by $429 million, or 9%, to $5,054 million in 2000 from $4,625 million in 1999. Excluding the impact of
the GenAmerica acquisition, policyholder benefits and claims decreased by $103 million, or 2%. Policyholder benefits and claims for insurance products
decreased by $111 million, or 2%, to $4,339 million in 2000 from $4,450 million in 1999. This decrease is predominately a result of improved mortality
and morbidity experience. Policyholder benefits and claims for annuity and investment products increased by $8 million, or 5%, to $183 million in 2000
from $175 million in 1999, commensurate with the increase in premiums discussed above.
Interest credited to policyholder account balances increased by $321 million, or 24%, to $1,680 million in 2000 from $1,359 million in 1999.
Excluding the impact of the GenAmerica acquisition, interest credited increased by $36 million, or 3%. Interest on insurance products increased by $26
million, or 6%, to $445 million in 2000 from $419 million in 1999, largely due to higher policyholder account balances. Higher crediting rates caused
interest on annuity and investment products to increase by $10 million, or 1%, to $950 million in 2000 from $940 million in 1999.
Policyholder dividends increased by $233 million, or 15%, to $1,742 million in 2000 from $1,509 million in 1999. Excluding the impact of the
GenAmerica acquisition, policyholder dividends increased by $33 million, or 2%. This increase is due to growth in cash values of policies associated with
this segment’s large block of traditional life insurance business.
Other expenses increased by $792 million, or 29%, to $3,511 million in 2000 from $2,719 million in 1999. Excluding the capitalization and
amortization of deferred policy acquisition costs, which are discussed below, other expenses increased by $784 million, or 27%, to $3,660 million in
2000 from $2,876 million in 1999. Excluding the impact of the GenAmerica acquisition, other expenses increased by $291 million, or 10%. Other
expenses related to insurance products increased by $182 million, or 8%, to $2,419 million in 2000 from $2,237 million in 1999. This increase is
attributable to a $111 million increase from the broker/dealer and other subsidiaries commensurate with the increase in other revenues discussed above.
In addition, increased volume in the securities lending program resulted in a $122 million increase in related rebate expense. These increases were
partially offset by a $51 million reduction in general and administrative expenses. Other expenses related to annuity and investment products increased
by $109 million, or 17%, to $748 million in 2000 from $639 million in 1999. This increase resulted from a $54 million increase in rebate expense
associated with the Company’s securities lending program. The remaining increase is largely attributable to a $54 million increase in general and
administrative expenses incurred in connection with initiatives focused on improving service delivery capabilities through investments in technology and
the consolidation of operations.
Deferred policy acquisition costs are principally amortized in proportion to gross margins or gross profits, including investment gains or losses. The
amortization is allocated to investment gains and losses to provide consolidated statement of income information regarding the impact of investment
gains and losses on the amount of the amortization, and other expenses to provide amounts related to gross margins or profits originating from
transactions other than investment gains and losses.
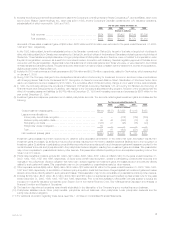
Capitalization of deferred policy acquisition costs increased by $90 million to $872 million in 2000 from $782 million in 1999, while total amortization
of deferred policy acquisition costs, charged to operations, increased by $49 million to $628 million in 2000 from $579 million in 1999. Excluding the
impact of the GenAmerica acquisition, capitalization of deferred policy acquisition costs decreased by $6 million, or 1%, while total amortization of
deferred policy acquisition costs decreased by $117 million, or 20%. Amortization of deferred policy acquisition costs of $723 million and $625 million are
allocated to other expenses in 2000 and 1999, respectively, while the remainder of the amortization in each year is allocated to investment gains and
losses. Excluding the impact of the GenAmerica acquisition, amortization of deferred policy acquisition costs of $585 million and $625 million are
allocated to other expenses in 2000 and 1999, respectively, while the remainder of the amortization in each year is allocated to investment gains and
losses. Amortization of deferred policy acquisition costs allocated to other expenses related to insurance products decreased by $128 million to $389
million in 2000 from $517 in 1999. This decrease is due to refinements in the calculation of estimated gross margins and profits, as well as the
acceleration of the recognition of unearned fees in connection with the product replacement program discussed above. Amortization of deferred policy
acquisition costs allocated to other expenses related to annuity and investment products increased by $88 million to $196 million in 2000 from $108
million in 1999. This increase is primarily due to refinements in the calculation of estimated gross profits.
Year ended December 31, 1999 compared with the year ended December 31, 1998
Premiums decreased by $34 million, or 1%, to $4,289 million in 1999 from $4,323 million in 1998. Premiums from insurance products decreased
by $16 million to $4,215 million in 1999 from $4,231 million in 1998. This decrease is primarily due to a decline in sales of traditional life insurance
policies, which reflects a continued shift in policyholders’ preferences from those policies to variable life products. Premiums from annuity and investment
products decreased by $18 million, or 20%, to $74 million in 1999 from $92 million in 1998, primarily due to lower sales of supplementary contracts with
life contingencies. The relatively high level of supplemental contract premiums in 1998 reflected the initial offering of a payout annuity feature in that year.
Universal life and investment-type product policy fees increased by $71 million, or 9%, to $888 million in 1999 from $817 million in 1998. Policy fees
from insurance products increased by $3 million, or 1%, to $571 million in 1999 from $568 million in 1998. This increase is attributable to a $77 million
increase in separate account contract fees arising from increased sales of variable life products. This increase is almost entirely offset by reinsurance
treaties entered into during 1998 related to $86 billion of universal life insurance in-force, which constitutes the majority of the mortality risk on universal life
business written subsequent to January 1, 1983. Policy fees from annuity and investment products increased by $68 million, or 27%, to $317 million in
1999 from $249 million in 1998, primarily due to the continued growth in deposits for investment products and stock market appreciation.
Other revenues increased by $84 million, or 18%, to $558 million in 1999 from $474 million in 1998. Other revenues for insurance products
increased by $85 million, or 19%, to $521 million in 1999 from $436 million in 1998. This increase is primarily attributable to the inclusion of a full year’s
activity of Nathan & Lewis, as well as increased commission and fee income associated with increased sales of non-proprietary products. Other
revenues for annuity and investment products are essentially flat at $37 million in 1999 compared with $38 million in 1998.
Policyholder benefits and claims increased by $19 million to $4,625 million in 1999 from $4,606 million in 1998. Policyholder benefits and claims for
insurance products increased by $85 million, or 2%, to $4,450 million in 1999 from $4,365 million in 1998. This increase is primarily due to growth in the
MetLife, Inc.
10