MetLife 2000 Annual Report Download - page 23
Download and view the complete annual report
Please find page 23 of the 2000 MetLife annual report below. You can navigate through the pages in the report by either clicking on the pages listed below, or by using the keyword search tool below to find specific information within the annual report.-
 1
1 -
2
-
3
-
4
-
5
-
6
-
7
-
8
-
9
-
10
-
11
-
12
-
 13
13 -
 14
14 -
 15
15 -
 16
16 -
 17
17 -
 18
18 -
 19
19 -
 20
20 -
 21
21 -
 22
22 -
 23
23 -
 24
24 -
 25
25 -
 26
26 -
 27
27 -
 28
28 -
 29
29 -
 30
30 -
 31
31 -
 32
32 -
 33
33 -
34
-
35
-
36
-
37
-
38
-
39
-
40
-
41
-
42
-
43
-
44
-
45
-
46
-
47
-
48
-
49
-
50
-
51
-
52
-
53
-
54
-
55
-
56
-
57
-
58
-
59
-
60
-
61
-
62
-
63
-
64
-
65
-
66
-
67
-
68
 |
 |

following characteristics: a reduction in the interest rate, an extension of the maturity date, an exchange of debt for equity or a partial forgiveness of
principal or interest.
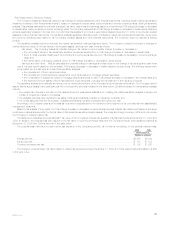
The following table presents the estimated fair value of the Company’s total fixed maturities classified as performing, problem, potential problem and
restructured fixed maturities at December 31, 2000 and 1999:
At December 31,
2000 1999
Estimated % of Estimated % of
Fair Value Total Fair Value Total
(Dollars in millions)
Performing ************************************************************************ $112,371 99.5% $96,464 99.5%
Problem ************************************************************************** 163 0.1 20 0.0
Potential Problem ****************************************************************** 364 0.3 482 0.5
Restructured ********************************************************************** 81 0.1 15 0.0
Total ********************************************************************* $112,979 100.0% $96,981 100.0%
The Company classifies all of its fixed maturities as available-for-sale and marks them to market. The Company writes down to fair value fixed
maturities that it deems to be other than temporarily impaired. The Company records write-downs as investment losses and includes them in earnings
and adjusts the cost basis of the fixed maturities accordingly. The Company does not change the revised cost basis for subsequent recoveries in value.
Such write-downs were $339 million and $98 million for the years ended December 31, 2000 and 1999, respectively.
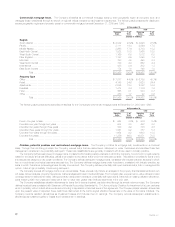
Fixed maturities by sector. The Company diversifies its fixed maturities by security sector. The following table sets forth the estimated fair value
of the Company’s fixed maturities by sector, as well as the percentage of the total fixed maturities holdings that each security sector comprised at
December 31, 2000 and 1999:
At December 31,
2000 1999
Estimated % of Estimated % of
Fair Value Total Fair Value Total
(Dollars in millions)
U.S. Treasuries/agencies ************************************************************ $ 9,634 8.5% $ 6,299 6.5%
Corporate securities **************************************************************** 56,553 50.1 55,543 57.3
Foreign government securities******************************************************** 5,341 4.7 4,206 4.3
Mortgage-backed securities********************************************************** 25,726 22.8 20,279 20.9
Asset-backed securities ************************************************************* 7,847 6.9 6,382 6.6
Other fixed income assets *********************************************************** 7,878 7.0 4,272 4.4
Total ********************************************************************* $112,979 100.0% $96,981 100.0%
Corporate fixed maturities. The table below shows the major industry types that comprise the corporate bond holdings at the dates indicated:
At December 31,
2000 1999
Estimated % of Estimated % of
Fair Value Total Fair Value Total
(Dollars in millions)
Industrial ********************************************************************** $27,199 48.1% $26,480 47.6%
Utility ************************************************************************* 7,011 12.4 6,487 11.7
Finance *********************************************************************** 12,722 22.5 11,631 21.0
Yankee/Foreign(1)*************************************************************** 9,291 16.4 10,423 18.8
Other ************************************************************************* 330 0.6 522 0.9
Total****************************************************************** $56,553 100.0% $55,543 100.0%
(1) Includes publicly traded, dollar-denominated debt obligations of foreign obligors, known as Yankee bonds, and other foreign investments.
The Company diversifies its corporate bond holdings by industry and issuer. The portfolio has no significant exposure to any single issuer. At
December 31, 2000, the Company’s combined holdings in the ten issuers to which it had the greatest exposure totaled $3,849 million, which was less
than 5% of the Company’s total invested assets at such date. The exposure to the largest single issuer of corporate bonds the Company held at
December 31, 2000 was $496 million, which was less than 1% of its total invested assets at such date.
At December 31, 2000, investments of $6,262 million, or 67.4% of the Yankee/Foreign sector, represented exposure to traditional Yankee bonds.
The balance of this exposure was primarily dollar-denominated, foreign private placements and project finance loans. The Company diversifies the
Yankee/Foreign portfolio by country and issuer.
The Company does not have material exposure to foreign currency risk in its invested assets. In the Company’s international insurance operations,
both its assets and liabilities are denominated in local currencies. Foreign currency denominated securities supporting U.S. dollar liabilities are generally
swapped back into U.S. dollars.
MetLife, Inc.
20