MetLife 2000 Annual Report Download - page 24
Download and view the complete annual report
Please find page 24 of the 2000 MetLife annual report below. You can navigate through the pages in the report by either clicking on the pages listed below, or by using the keyword search tool below to find specific information within the annual report.-
 1
1 -
2
-
3
-
4
-
5
-
6
-
7
-
8
-
9
-
10
-
11
-
12
-
13
-
 14
14 -
 15
15 -
 16
16 -
 17
17 -
 18
18 -
 19
19 -
 20
20 -
 21
21 -
 22
22 -
 23
23 -
 24
24 -
 25
25 -
 26
26 -
 27
27 -
 28
28 -
 29
29 -
 30
30 -
 31
31 -
 32
32 -
 33
33 -
 34
34 -
35
-
36
-
37
-
38
-
39
-
40
-
41
-
42
-
43
-
44
-
45
-
46
-
47
-
48
-
49
-
50
-
51
-
52
-
53
-
54
-
55
-
56
-
57
-
58
-
59
-
60
-
61
-
62
-
63
-
64
-
65
-
66
-
67
-
68
 |
 |

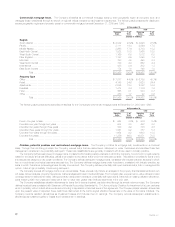
Mortgage-backed securities. The following table shows the types of mortgage-backed securities the Company held at December 31, 2000
and 1999:
At December 31,
2000 1999
Estimated % of Estimated % of
Fair Value Total Fair Value Total
(Dollars in millions)
Pass-through securities *********************************************************** $10,610 41.3% $ 8,478 41.8%
Collateralized mortgage obligations ************************************************** 9,866 38.3 7,694 37.9
Commercial mortgage-backed securities ********************************************* 5,250 20.4 4,107 20.3
Total ******************************************************************* $25,726 100.0% $20,279 100.0%
At December 31, 2000, pass-through and collateralized mortgage obligations totaled $20,476 million, or 79.6% of total mortgage-backed
securities, and a majority of this amount represented agency-issued pass-through and collateralized mortgage obligations guaranteed or otherwise
supported by the Federal National Mortgage Association, Federal Home Loan Mortgage Corporation or Government National Mortgage Association.
Other types of mortgage-backed securities comprised the balance of such amounts reflected in the table. At December 31, 2000, approximately $3,202
million, or 61.0% of the commercial mortgage-backed securities, and $17,303 million, or 84.5% of the pass-through securities and collateralized
mortgage obligations, were rated Aaa/AAA by Moody’s or S&P.
The principal risks inherent in holding mortgage-backed securities are prepayment and extension risks, which will affect the timing of when cash flow
will be received. The Company’s active monitoring of its mortgage-backed securities mitigates exposure to losses from cash flow risk associated with
interest rate fluctuations.
Asset-backed securities. Asset-backed securities, which include credit card and automobile receivables and home equity loans, are pur-
chased both to diversify the overall risks of the Company’s fixed maturities assets and to provide attractive returns. The Company’s asset-backed
securities are diversified both by type of asset and by issuer. Home equity loans constitute the largest exposure in the Company’s asset-backed
securities investments. Except for asset-backed securities backed by home equity loans, the asset-backed securities investments generally have little
sensitivity to changes in interest rates. At December 31, 2000, approximately $3,149 million, or 40.1%, of total asset-backed securities were rated
Aaa/AAA by Moody’s or S&P.
The principal risks in holding asset-backed securities are structural, credit and capital market risks. Structural risks include the security’s priority in the
issuer’s capital structure, the adequacy of and ability to realize proceeds from the collateral and the potential for prepayments. Credit risks include
consumer or corporate credits such as credit card holders, equipment lessees, and corporate obligors. Capital market risks include the general level of
interest rates and the liquidity for these securities in the marketplace.
Mortgage Loans
The Company’s mortgage loans are collateralized by commercial, agricultural and residential properties. Mortgage loans comprised 13.7% and
14.3% of the Company’s total cash and invested assets at December 31, 2000 and 1999, respectively. The carrying value of mortgage loans is stated at
original cost net of repayments, amortization of premiums, accretion of discounts and valuation allowances. The following table shows the carrying value
of the Company’s mortgage loans by type at December 31, 2000 and 1999:
At December 31,
2000 1999
Carrying % of Carrying % of
Value Total Value Total
(Dollars in millions)
Commercial ********************************************************************* $16,869 76.8% $14,862 75.3%
Agricultural ********************************************************************** 4,973 22.7 4,798 24.3
Residential ********************************************************************** 109 0.5 79 0.4
Total ******************************************************************* $21,951 100.0% $19,739 100.0%
MetLife, Inc. 21