MetLife 2000 Annual Report Download - page 54
Download and view the complete annual report
Please find page 54 of the 2000 MetLife annual report below. You can navigate through the pages in the report by either clicking on the pages listed below, or by using the keyword search tool below to find specific information within the annual report.-
 1
1 -
2
-
3
-
4
-
5
-
6
-
7
-
8
-
9
-
10
-
11
-
12
-
13
-
14
-
15
-
16
-
17
-
18
-
19
-
20
-
21
-
22
-
23
-
24
-
25
-
26
-
27
-
28
-
29
-
30
-
31
-
32
-
33
-
34
-
35
-
36
-
37
-
38
-
39
-
40
-
41
-
42
-
43
-
 44
44 -
 45
45 -
 46
46 -
 47
47 -
 48
48 -
 49
49 -
 50
50 -
 51
51 -
 52
52 -
 53
53 -
 54
54 -
 55
55 -
 56
56 -
 57
57 -
 58
58 -
 59
59 -
 60
60 -
 61
61 -
 62
62 -
 63
63 -
 64
64 -
65
-
66
-
67
-
68
 |
 |

METLIFE, INC.
NOTES TO CONSOLIDATED FINANCIAL STATEMENTS — (Continued)
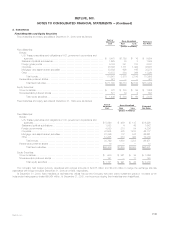
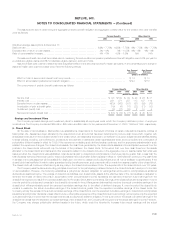
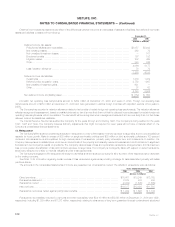
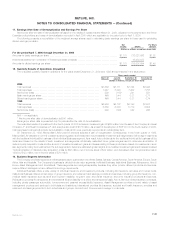
Closed block revenues and expenses were as follows:
April 7, 2000
through
December 31, 2000
(Dollars in millions)
Revenues
Premiums ***************************************************************************** $2,900
Net investment income ****************************************************************** 1,949
Net investment losses (net of amounts allocable to the policyholder dividend obligation of $(85)) ***** (150)
Total revenues 4,699
Expenses
Policyholder benefits and claims*********************************************************** 2,874
Policyholder dividends ******************************************************************* 1,132
Change in policyholder dividend obligation (includes amounts directly related to net investment losses
of $(85))***************************************************************************** 85
Other expenses ************************************************************************ 425
Total expenses 4,516
Revenues net of expenses before income taxes ********************************************* 183
Income taxes ************************************************************************** 67
Revenues net of expenses and income taxes *********************************************** $ 116
The change in maximum future earnings of the closed block was as follows:
(Dollars in millions)
April 7, 2000*************************************************************************** $5,628
December 31, 2000 ******************************************************************** 5,512
Change during the period **************************************************************** $ (116)
Metropolitan Life charges the closed block with federal income taxes, state and local premium taxes, and other additive state or local taxes, as well
as investment management expenses relating to the closed block as provided in the plan of reorganization. Metropolitan Life also charges the closed
block for expenses of maintaining the policies included in the closed block.
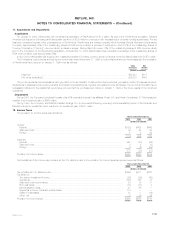
7. Separate Accounts
Separate accounts reflect two categories of risk assumption: non-guaranteed separate accounts totaling $53,656 million and $47,618 million at
December 31, 2000 and 1999, respectively, for which the policyholder assumes the investment risk, and guaranteed separate accounts totaling
$16,594 million and $17,323 million at December 31, 2000 and 1999, respectively, for which the Company contractually guarantees either a minimum
return or account value to the policyholder.
Fees charged to the separate accounts by the Company (including mortality charges, policy administration fees and surrender charges) are reflected
in the Company’s revenues as universal life and investment-type product policy fees and totaled $667 million, $485 million and $413 million for the years
ended December 31, 2000, 1999 and 1998, respectively. Guaranteed separate accounts consisted primarily of Met Managed Guaranteed Interest
Contracts and participating close out contracts. The average interest rates credited on these contracts were 6.9% and 6.5% at December 31, 2000 and
1999, respectively. The assets that support these liabilities were comprised of $15,708 million and $16,874 million in fixed maturities at December 31,
2000 and 1999, respectively. The portfolios are segregated from other investments and are managed to minimize liquidity and interest rate risk. In order
to minimize the risk of disintermediation associated with early withdrawals, these investment products carry a graded surrender charge as well as a
market value adjustment.
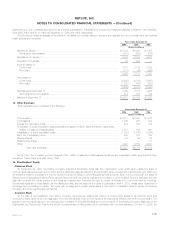
8. Debt
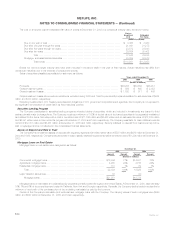
Debt consisted of the following:
December 31,
2000 1999
(Dollars in millions)
Surplus notes, interest rates ranging from 6.30% to 7.80%, maturity dates ranging from 2003 to 2025 ***** $1,650 $1,546
Investment related exchangeable debt, interest rates ranging from 4.90% to 5.40%, due 2001 and 2002 *** 271 369
Fixed rate notes, interest rates ranging from 5.29% to 10.50%, maturity dates ranging from 2001 to 2009 ** 316 187
Senior notes, interest rates ranging from 7.06% to 7.25%, maturity dates ranging from 2003 to 2007 ****** 98 270
Capital lease obligations *********************************************************************** 42 44
Other notes with varying interest rates *********************************************************** 49 98
Total long-term debt ************************************************************************** 2,426 2,514
Total short-term debt ************************************************************************** 1,094 4,208
Total ******************************************************************************* $3,520 $6,722
MetLife, Inc. F-23