MetLife 2000 Annual Report Download - page 10
Download and view the complete annual report
Please find page 10 of the 2000 MetLife annual report below. You can navigate through the pages in the report by either clicking on the pages listed below, or by using the keyword search tool below to find specific information within the annual report.-
 1
1 -
 2
2 -
 3
3 -
 4
4 -
 5
5 -
 6
6 -
 7
7 -
 8
8 -
 9
9 -
 10
10 -
 11
11 -
 12
12 -
 13
13 -
 14
14 -
 15
15 -
 16
16 -
 17
17 -
 18
18 -
 19
19 -
 20
20 -
 21
21 -
22
-
23
-
24
-
25
-
26
-
27
-
28
-
29
-
30
-
31
-
32
-
33
-
34
-
35
-
36
-
37
-
38
-
39
-
40
-
41
-
42
-
43
-
44
-
45
-
46
-
47
-
48
-
49
-
50
-
51
-
52
-
53
-
54
-
55
-
56
-
57
-
58
-
59
-
60
-
61
-
62
-
63
-
64
-
65
-
66
-
67
-
68
 |
 |
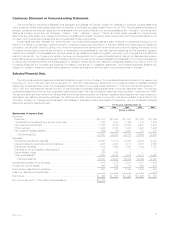
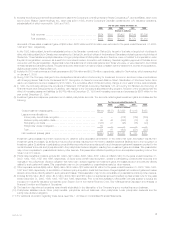
Policyholder dividends increased by $229 million, or 14%, to $1,919 million in 2000 from $1,690 million in 1999. Excluding the acquisition of
GenAmerica, policyholder dividends increased by $20 million, or 1%. Policyholder dividends vary from period to period based on participating group and
traditional individual life insurance contract experience.
Payments of $327 million were made during the second quarter of 2000, as part of Metropolitan Life’s demutualization, to holders of certain policies
transferred to Clarica Life Insurance Company in connection with the sale of a substantial portion of the Canadian operations in 1998.
Demutualization costs decreased by $30 million, or 12%, to $230 million in 2000 from $260 million in 1999. These costs are related to Metropolitan
Life’s demutualization on April 7, 2000.
Other expenses increased by $1,472 million, or 22%, to $8,227 million in 2000 from $6,755 million in 1999. Excluding the capitalization and
amortization of deferred policy acquisition costs, which are discussed below, other expenses increased by $1,627 million, or 23%, to $8,612 million in
2000 from $6,985 million in 1999. Excluding the impact of the GenAmerica acquisition, other expenses increased by $300 million, or 4%. This increase
is primarily attributable to increases in Auto & Home, Individual Business, Institutional Business and International. These increases are partially offset by a
$396 million, or 38%, decrease in Corporate and a $101 million, or 13%, decrease in Asset Management. The increase in Auto & Home of $311 million,
or 59%, is largely due to the St. Paul acquisition. The increase in Individual Business of $291 million, or 10%, is partially attributable to a $111 million
increase from the broker/dealer and other subsidiaries commensurate with the increase in other revenues and increased securities lending volume. The
increase in Institutional Business of $144 million, or 9%, is primarily due to costs incurred in connection with initiatives focused on improving service
delivery capabilities through investments in technology and an increase in volume-related expenses associated with premium growth. Volume-related
expenses include premium taxes, separate account investment management expenses and commissions. The increase in International of $45 million, or
14%, is primarily attributable to expenses incurred in connection with business expansion efforts in several countries. The decrease in Corporate is
primarily due to a $499 million charge in 1999 principally related to the settlement of a multidistrict litigation proceeding involving alleged improper sales
practices, accruals for sales practices claims not covered by the settlement and other legal costs. The most significant factor contributing to the decline in
Asset Management is the sale of Nvest, which occurred on October 30, 2000.
Deferred policy acquisition costs are principally amortized in proportion to gross margins or profits, including investment gains or losses. The
amortization is allocated to investment gains and losses to provide consolidated statement of income information regarding the impact of investment
gains and losses on the amount of the amortization, and other expenses to provide amounts related to gross margins or profits originating from
transactions other than investment gains and losses.
Capitalization of deferred policy acquisition costs increased to $1,863 million in 2000 from $1,160 million in 1999 while total amortization of deferred
policy acquisition costs, charged to operations, increased to $1,383 million in 2000 from $884 million in 1999. Excluding the impact of the GenAmerica
acquisition, capitalization of deferred policy acquisition costs increased to $1,413 million in 2000 from $1,160 in 1999 while total amortization of deferred
policy acquisition costs increased to $1,012 million in 2000 from $884 million in 1999. Amortization of deferred policy acquisition costs of $1,478 million
and $930 million are allocated to other expenses in 2000 and 1999, respectively, while the remainder of the amortization in each year is allocated to
investment losses. Excluding the impact of the GenAmerica acquisition, amortization of deferred policy acquisition costs of $1,136 million and $930
million are allocated to other expenses in 2000 and 1999, respectively, while the remainder of the amortization in each year is allocated to investment
losses. The increase in amortization of deferred policy acquisition costs allocated to other expenses was predominately attributable to Auto & Home’s
acquisition of St. Paul.
Income tax expense for the year ended December 31, 2000 was $463 million, or 33% of income before provision for income taxes, compared with
$558 million, or 47%, in 1999. The 2000 effective tax rate differs from the corporate tax rate of 35% due to non-deductible payments made in the second
quarter of 2000 to former Canadian policyholders in connection with the demutualization, a surplus tax benefit of $145 million and a reduction in prior year
taxes on capital gains associated with the sale of businesses recorded in the third quarter of 2000. The 1999 effective rate differs from the corporate tax
rate of 35% primarily due to the impact of surplus tax. Prior to its demutualization, Metropolitan Life was subject to surplus tax imposed on mutual life
insurance companies under Section 809 of the Internal Revenue Code. The surplus tax results from the disallowance of a portion of a mutual life
insurance company’s policyholder dividends as a deduction from taxable income.
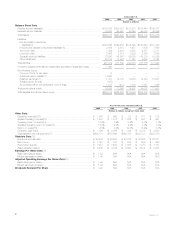
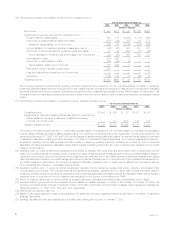
Year ended December 31, 1999 compared with the year ended December 31, 1998
Premiums increased by 5% to $12,088 million in 1999 from $11,503 million in 1998. This increase is attributable to strong growth in Institutional
Business of $366 million, or 7%, and Auto & Home of $348 million, or 25%. These increases are partially offset by decreases in International of $95
million, or 15%, and in Individual Business of $34 million, or 1%. Institutional Business’ growth is primarily driven by an increase in non-medical health
premiums due to increased sales and improved policyholder retention in its dental and disability businesses. Auto & Home’s premium increase is primarily
due to the St. Paul acquisition, of which represents $262 million of the increase, as well as growth in both standard and non-standard auto insurance
businesses. International’s premium decrease is primarily due to the disposition of a substantial portion of the Company’s Canadian operations in
July 1998. The Individual Business decrease is primarily attributable to the decline in sales of traditional life insurance policies, which reflects a continued
shift in customers’ investment preferences from those policies to variable life products, as well as decreased sales of supplementary contracts with life
contingencies.
Universal life and investment-type product policy fees increased by 5% to $1,433 million in 1999 from $1,360 million in 1998. This increase is
attributable to increases of $71 million, or 9%, in Individual Business and $27 million, or 6%, in Institutional Business. These increases are partially offset
by a decrease in International of $25 million, or 37%. The Individual Business policy fee increase is, in large part, due to the continued growth in deposits
for investment products as well as stock market appreciation. The $27 million increase in Institutional Business’ policy fees is primarily due to continued
growth in sales of products used in executive and corporate-owned benefit plans. The majority of International’s policy fee decrease is a result of the sale
of a substantial portion of the Company’s Canadian operations.
Net investment income decreased by 4% to $9,816 million in 1999 from $10,228 million in 1998. This decrease is primarily due to reductions in
(i) investment income related to mortgage loans on real estate of $93 million, or 6%, (ii) investment income on other invested assets of $340 million, or
40%, (iii) equity securities income of $38 million, or 49%, (iv) policy loan income of $47 million, or 12%, and (v) real estate and real estate joint ventures
income, after investment expenses and depreciation, of $106 million, or 15%. These reductions in net investment income are partially offset by higher
income from fixed maturities of $203 million, or 3%. The reduction in investment income from mortgage loans on real estate to $1,479 million in 1999
from $1,572 million in 1998 is due to a reduction in principal balances in MetLife Capital Holdings, Inc. and a substantial portion of the Company’s
Canadian operations, which were sold in 1998, the proceeds of which were reinvested in fixed maturities. Likewise, the increase in fixed maturity
investment income to $6,766 million in 1999 from $6,563 million in 1998 is primarily attributable to increased average principal balances due, in part, to
the reinvestment of proceeds from the sale of MetLife Capital Holdings, as well as from sales of equity securities, the dispositions of which were part of
MetLife, Inc. 7