MetLife 2000 Annual Report Download - page 44
Download and view the complete annual report
Please find page 44 of the 2000 MetLife annual report below. You can navigate through the pages in the report by either clicking on the pages listed below, or by using the keyword search tool below to find specific information within the annual report.-
 1
1 -
2
-
3
-
4
-
5
-
6
-
7
-
8
-
9
-
10
-
11
-
12
-
13
-
14
-
15
-
16
-
17
-
18
-
19
-
20
-
21
-
22
-
23
-
24
-
25
-
26
-
27
-
28
-
29
-
30
-
31
-
32
-
33
-
 34
34 -
 35
35 -
 36
36 -
 37
37 -
 38
38 -
 39
39 -
 40
40 -
 41
41 -
 42
42 -
 43
43 -
 44
44 -
 45
45 -
 46
46 -
 47
47 -
 48
48 -
 49
49 -
 50
50 -
 51
51 -
 52
52 -
 53
53 -
 54
54 -
55
-
56
-
57
-
58
-
59
-
60
-
61
-
62
-
63
-
64
-
65
-
66
-
67
-
68
 |
 |

METLIFE, INC.
NOTES TO CONSOLIDATED FINANCIAL STATEMENTS — (Continued)
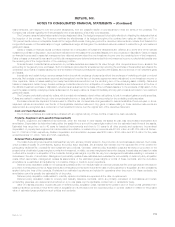
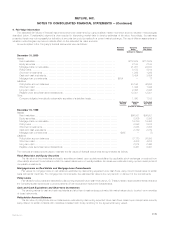
2. Investments
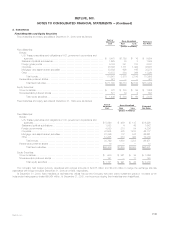
Fixed Maturities and Equity Securities
Fixed maturities and equity securities at December 31, 2000 were as follows:
Cost or Gross Unrealized
Amortized Estimated
Cost Gain Loss Fair Value
(Dollars in millions)
Fixed Maturities:
Bonds:
U.S. Treasury securities and obligations of U.S. government corporations and
agencies ************************************************************* $ 8,461 $1,189 $ 16 $ 9,634
States and political subdivisions ******************************************** 1,563 79 3 1,639
Foreign governments ***************************************************** 5,153 341 153 5,341
Corporate ************************************************************** 48,893 1,181 1,493 48,581
Mortgage- and asset-backed securities ************************************* 33,039 699 165 33,573
Other ****************************************************************** 13,872 384 366 13,890
Total bonds ********************************************************* 110,981 3,873 2,196 112,658
Redeemable preferred stocks************************************************ 321 — — 321
Total fixed maturities************************************************** $111,302 $3,873 $2,196 $112,979
Equity Securities:
Common stocks*********************************************************** $ 872 $ 785 $ 55 $ 1,602
Nonredeemable preferred stocks ********************************************* 577 19 5 591
Total equity securities************************************************* $ 1,449 $ 804 $ 60 $ 2,193
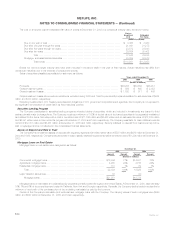
Fixed maturities and equity securities at December 31, 1999 were as follows:
Cost or Gross Unrealized
Amortized Estimated
Cost Gain Loss Fair Value
(Dollars in millions)
Fixed Maturities:
Bonds:
U.S. Treasury securities and obligations of U.S. government corporations and
agencies********************************************************** $ 5,990 $ 456 $ 147 $ 6,299
States and political subdivisions **************************************** 1,583 4 45 1,542
Foreign governments ************************************************* 4,090 210 94 4,206
Corporate*********************************************************** 47,505 585 1,913 46,177
Mortgage- and asset-backed securities ********************************** 27,396 112 847 26,661
Other ************************************************************** 12,235 313 462 12,086
Total bonds ***************************************************** 98,799 1,680 3,508 96,971
Redeemable preferred stocks ******************************************** 10 — — 10
Total fixed maturities ********************************************** $98,809 $1,680 $3,508 $96,981
Equity Securities:
Common stocks ******************************************************* $ 980 $ 921 $ 35 $ 1,866
Nonredeemable preferred stocks ***************************************** 151 — 11 140
Total equity securities ********************************************* $ 1,131 $ 921 $ 46 $ 2,006
The Company held foreign currency derivatives with notional amounts of $3,885 million and $4,002 million to hedge the exchange rate risk
associated with foreign bonds at December 31, 2000 and 1999, respectively.
At December 31, 2000, fixed maturities at estimated fair values held by the Company that were below investment grade or not rated by an
independent rating agency totaled $9,864 million. At December 31, 2000, non-income producing fixed maturities were insignificant.
MetLife, Inc. F-13