MetLife 2000 Annual Report Download - page 47
Download and view the complete annual report
Please find page 47 of the 2000 MetLife annual report below. You can navigate through the pages in the report by either clicking on the pages listed below, or by using the keyword search tool below to find specific information within the annual report.-
 1
1 -
2
-
3
-
4
-
5
-
6
-
7
-
8
-
9
-
10
-
11
-
12
-
13
-
14
-
15
-
16
-
17
-
18
-
19
-
20
-
21
-
22
-
23
-
24
-
25
-
26
-
27
-
28
-
29
-
30
-
31
-
32
-
33
-
34
-
35
-
36
-
 37
37 -
 38
38 -
 39
39 -
 40
40 -
 41
41 -
 42
42 -
 43
43 -
 44
44 -
 45
45 -
 46
46 -
 47
47 -
 48
48 -
 49
49 -
 50
50 -
 51
51 -
 52
52 -
 53
53 -
 54
54 -
 55
55 -
 56
56 -
 57
57 -
58
-
59
-
60
-
61
-
62
-
63
-
64
-
65
-
66
-
67
-
68
 |
 |

METLIFE, INC.
NOTES TO CONSOLIDATED FINANCIAL STATEMENTS — (Continued)
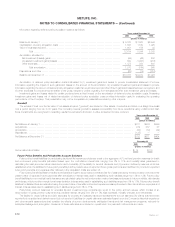
The Company’s real estate holdings are primarily located throughout the United States. At December 31, 2000, approximately 26%, 25% and 10%
of the Company’s real estate holdings were located in New York, California and Texas, respectively.
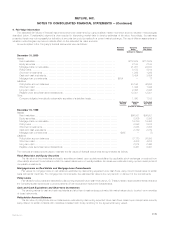
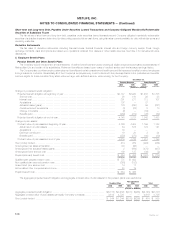
Changes in real estate and real estate joint ventures held-for-sale valuation allowance were as follows:
Years ended December 31,
2000 1999 1998
(Dollars in millions)
Balance at January 1 *************************************************************************** $ 34 $ 33 $110
Additions charged (credited) to operations ********************************************************** 17 36 (5)
Deductions for writedowns and dispositions********************************************************* (12) (35) (72)
Balance at December 31 ************************************************************************ $ 39 $ 34 $ 33
Investment income related to impaired real estate and real estate joint ventures held-for-investment was $45 million, $61 million and $105 million for
the years ended December 31, 2000, 1999 and 1998, respectively. Investment income related to impaired real estate and real estate joint ventures held-
for-sale was $18 million, $14 million and $3 million for the years ended December 31, 2000, 1999 and 1998, respectively. The carrying value of non-
income producing real estate and real estate joint ventures was $15 million and $22 million at December 31, 2000 and 1999, respectively.
The Company owned real estate acquired in satisfaction of debt of $66 million and $47 million at December 31, 2000 and 1999, respectively.
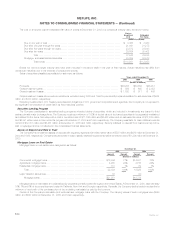
Leveraged Leases
Leveraged leases, included in other invested assets, consisted of the following:
December 31,
2000 1999
(Dollars in millions)
Investment ********************************************************************************** $1,002 $1,016
Estimated residual values ********************************************************************** 546 559
Total *********************************************************************************** 1,548 1,575
Unearned income **************************************************************************** (384) (417)
Leveraged leases ************************************************************************ $1,164 $1,158
The investment amounts set forth above are generally due in monthly installments. The payment periods generally range from three to 15 years, but
in certain circumstances are as long as 30 years. These receivables are generally collateralized by the related property.
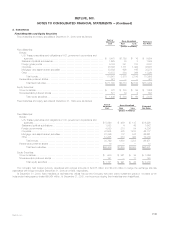
Net Investment Income
The components of net investment income were as follows:
Years ended December 31,
2000 1999 1998
(Dollars in millions)
Fixed maturities ************************************************************************* $ 8,538 $ 7,171 $ 6,990
Equity securities ************************************************************************ 41 40 78
Mortgage loans on real estate************************************************************* 1,693 1,484 1,580
Real estate and real estate joint ventures *************************************************** 1,407 1,426 1,529
Policy loans **************************************************************************** 515 340 387
Other limited partnership interests********************************************************** 142 199 196
Cash, cash equivalents and short-term investments ****************************************** 288 173 187
Other ********************************************************************************* 162 91 406
Total ****************************************************************************** 12,786 10,924 11,353
Less: Investment expenses *************************************************************** 1,018 1,108 1,125
Net investment income ************************************************************** $11,768 $ 9,816 $10,228
MetLife, Inc.
F-16