MetLife 2000 Annual Report Download - page 6
Download and view the complete annual report
Please find page 6 of the 2000 MetLife annual report below. You can navigate through the pages in the report by either clicking on the pages listed below, or by using the keyword search tool below to find specific information within the annual report.-
 1
1 -
 2
2 -
 3
3 -
 4
4 -
 5
5 -
 6
6 -
 7
7 -
 8
8 -
 9
9 -
 10
10 -
 11
11 -
 12
12 -
 13
13 -
 14
14 -
 15
15 -
 16
16 -
 17
17 -
18
-
19
-
20
-
21
-
22
-
23
-
24
-
25
-
26
-
27
-
28
-
29
-
30
-
31
-
32
-
33
-
34
-
35
-
36
-
37
-
38
-
39
-
40
-
41
-
42
-
43
-
44
-
45
-
46
-
47
-
48
-
49
-
50
-
51
-
52
-
53
-
54
-
55
-
56
-
57
-
58
-
59
-
60
-
61
-
62
-
63
-
64
-
65
-
66
-
67
-
68
 |
 |

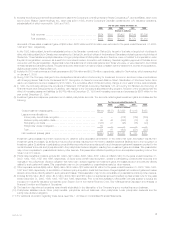
(1) Includes the following combined financial statement data of the Company’s controlling interest in Nvest Companies L.P. and its affiliates, which were
sold in 2000, MetLife Capital Holdings, Inc., which was sold in 1998, and the Company’s Canadian operations and U.K. insurance operations,
substantially all of which were sold in 1998 and 1997:
For the years ended December 31,
2000 1999 1998 1997 1996
(Dollars in millions)
Total revenues ******************************************** $524 $655 $1,405 $2,149 $1,890
Total expenses******************************************** $492 $603 $1,275 $1,870 $1,412
As a result of these sales, investment gains of $663 million, $520 million and $139 million were recorded for the years ended December 31, 2000,
1998 and 1997, respectively.
In July 1998, Metropolitan Life sold a substantial portion of its Canadian operations to Clarica Life. As part of that sale, a large block of policies in
effect with Metropolitan Life in Canada were transferred to Clarica Life, and the holders of the transferred Canadian policies became policyholders of
Clarica Life. Those transferred policyholders are no longer policyholders of Metropolitan Life and, therefore, were not entitled to compensation under
the plan of reorganization. However, as a result of a commitment made in connection with obtaining Canadian regulatory approval of that sale and in
connection with the demutualization, Metropolitan Life’s Canadian branch made cash payments to those who were, or were deemed to be, holders
of these transferred Canadian policies. The payments were determined in a manner that is consistent with the treatment of, and fair and equitable to,
eligible policyholders of Metropolitan Life.
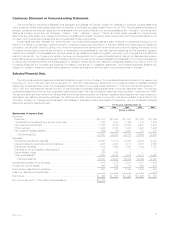
(2) Included in 2000 total revenues and total expenses are $3,754 million and $3,576 million, respectively, related to GenAmerica, which was acquired
on January 6, 2000.
(3) During 1997, the Company changed to the retrospective interest method of accounting for investment income on structured notes in accordance
with Emerging Issues Task Force Consensus 96-12, Recognition of Interest Income and Balance Sheet Classification of Structured Notes. As a
result, net investment income increased by $175 million. The cumulative effect of this accounting change on prior years’ income was immaterial.
(4) In 1998, the Company adopted the provisions of Statement of Financial Accounting Standards 125, Accounting for Transfers and Servicing of
Financial Assets and Extinguishments of Liabilities, with respect to the Company’s securities lending program. Adoption of the provisions had the
effect of increasing assets and liabilities by $3,769 million at December 31, 1998 and increasing revenues and expenses by $266 million for the
year ended December 31, 1998.
(5) Investment gains and losses are presented net of related policyholder amounts. The amounts netted against investment gains and losses are the
following:
For the years ended December 31,
2000 1999 1998 1997 1996
(Dollars in millions)
Gross investment (losses) gains************************************* $(444) $(137) $ 2,629 $ 1,018 $ 458
Less amounts allocable to:
Future policy benefit loss recognition******************************* — — (272) (126) (203)
Deferred policy acquisition costs ********************************** 95 46 (240) (70) (4)
Participating contracts ******************************************* (126) 21 (96) (35) (20)
Policyholder dividend obligation *********************************** 85————
Total********************************************************** 54 67 (608) (231) (227)
Net investment (losses) gains ************************************** $(390) $ (70) $ 2,021 $ 787 $ 231
Investment gains (losses) have been reduced by (1) deferred policy acquisition amortization to the extent that such amortization results from
investment gains and losses, (2) additions to future policy benefits resulting from the need to establish additional liabilities due to the recognition of
investment gains (3) additions to participating contractholder accounts when amounts equal to such investment gains and losses are credited to the
contractholders’ accounts, and (4) adjustments to the policyholder dividend obligation resulting from investment gains and losses. This presentation
may not be comparable to presentations made by other insurers. This presentation affected operating income and adjusted operating income. See
notes 12 and 13 below.
(6) Policyholder benefits and claims exclude $41 million, $(21) million, $368 million, $161 million and $223 million for the years ended December 31,
2000, 1999, 1998, 1997 and 1996, respectively, of future policy benefit loss recognition, credits to participating contractholder accounts and
changes in the policyholder dividend obligation that have been charged against net investment gains and losses as such amounts are directly
related to such gains and losses. This presentation may not be comparable to presentations made by other insurers.
(7) Other expenses exclude $(95) million, $(46) million, $240 million, $70 million and $4 million for the years ended December 31, 2000, 1999, 1998,
1997 and 1996, respectively, of amortization of deferred policy acquisition costs that have been charged against net investment gains and losses
as such amounts are directly related to such gains and losses. This presentation may not be comparable to presentations made by other insurers.
(8) Includes $(145) million, $125 million, $18 million, $(40) million and $38 million for surplus tax accrued (credited) by Metropolitan Life for the years
ended December 31, 2000, 1999, 1998, 1997 and 1996, respectively. Prior to its demutualization, Metropolitan Life was subject to surplus tax
imposed on mutual life insurance companies under Section 809 of the Internal Revenue Code. See ‘‘Management’s Discussion and Analysis of
Financial Condition and Results of Operations.’’
(9) The loss from discontinued operations was primarily attributable to the disposition of the Company’s group medical insurance business.
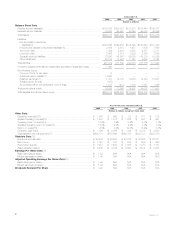
(10) Policyholder liabilities include future policy benefits, policyholder account balances, other policyholder funds, policyholder dividends and the
policyholder dividend obligation.
(11) For additional information regarding these items, see Note 1 of Notes to Consolidated Financial Statements.
MetLife, Inc. 3