MetLife 2000 Annual Report Download - page 64
Download and view the complete annual report
Please find page 64 of the 2000 MetLife annual report below. You can navigate through the pages in the report by either clicking on the pages listed below, or by using the keyword search tool below to find specific information within the annual report.-
 1
1 -
2
-
3
-
4
-
5
-
6
-
7
-
8
-
9
-
10
-
11
-
12
-
13
-
14
-
15
-
16
-
17
-
18
-
19
-
20
-
21
-
22
-
23
-
24
-
25
-
26
-
27
-
28
-
29
-
30
-
31
-
32
-
33
-
34
-
35
-
36
-
37
-
38
-
39
-
40
-
41
-
42
-
43
-
44
-
45
-
46
-
47
-
48
-
49
-
50
-
51
-
52
-
53
-
 54
54 -
 55
55 -
 56
56 -
 57
57 -
 58
58 -
 59
59 -
 60
60 -
 61
61 -
 62
62 -
 63
63 -
 64
64 -
 65
65 -
 66
66 -
 67
67 -
 68
68
 |
 |

METLIFE, INC.
NOTES TO CONSOLIDATED FINANCIAL STATEMENTS — (Continued)
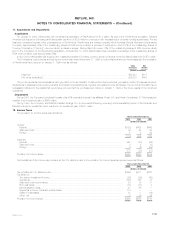
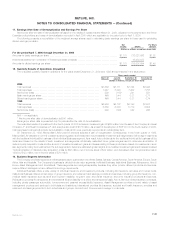
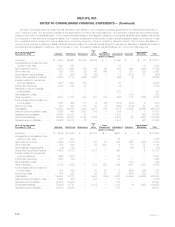
17. Earnings After Date of Demutualization and Earnings Per Share
Net income after the date of demutualization is based on the results of operations after March 31, 2000, adjusted for the payments to the former
Canadian policyholders and costs of demutualization recorded in April 2000 which are applicable to the period prior to April 7, 2000.
The following presents a reconciliation of the weighted average shares used in calculating basic earnings per share to those used in calculating
diluted earnings per share.
Net Per Share
Income Shares Amount
(Dollars in millions, except per share data)
For the period April 7, 2000 through December 31, 2000
Amounts for basic earnings per share *********************************************************** $1,173 772,027,666 $1.52
Incremental shares from conversion of forward purchase contracts *********************************** 16,480,028
Amounts for diluted earnings per share ********************************************************** $1,173 788,507,694 $1.49
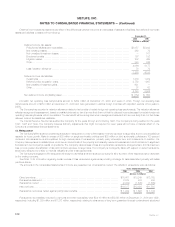
18. Quarterly Results of Operations (Unaudited)
The unaudited quarterly results of operations for the years ended December 31, 2000 and 1999 are summarized in the table below:
Three months ended
March 31 June 30 September 30 December 31
(Dollars in millions, except per share data)
2000
Total revenues *********************************************************** $7,666 $8,111 $7,744 $8,426
Total expenses ********************************************************** 7,247 8,094 7,432 7,758
Net income (loss) ******************************************************** 236 (115)* 241 591
Basic earnings per share ************************************************** N/A 0.44 0.31 0.77
Diluted earnings per share ************************************************* N/A 0.44 0.31 0.74
1999
Total revenues *********************************************************** $5,964 $6,172 $6,198 $7,087
Total expenses ********************************************************** 5,560 6,303 5,779 6,604
Net income (loss) ******************************************************** 229 (120) 242 266
N/A — not applicable
* Net income after date of demutualization is $341 million.
Earnings per share data is presented only for periods after the date of demutualization.
The unaudited results of operations for the fourth quarter of 2000 include an investment gain of $663 million from the sale of the Company’s interest
in Nvest, L.P. and Nvest Companies L.P. and a surplus tax credit of $175 million. As a result of the adoption of SOP 00-3 in the fourth quarter of 2000,
total expenses for all periods include demutualization costs which were previously reported as an extraordinary item.
On September 28, 1999, Metropolitan Life’s board of directors adopted a plan of reorganization. Consequently, in the fourth quarter of 1999,
Metropolitan Life was able to commit to state insurance regulatory authorities that it would establish investment sub-segments to further align investments
with the traditional individual life business of the Individual Business segment. As a result, future dividends for the traditional individual life business will be
determined based on the results of such investment sub-segments. Additionally, estimated future gross margins used to determine amortization of
deferred policy acquisition costs and the amount of unrealized investment gains and losses relating to these products are based on investments in such
sub-segments. Using the investments in the sub-segments to determine estimated gross margins and unrealized investment gains and losses increased
1999 amortization of deferred policy acquisition costs by $56 million, net of income taxes of $32 million, and decreased other comprehensive loss in
1999 by $123 million, net of income taxes of $70 million.
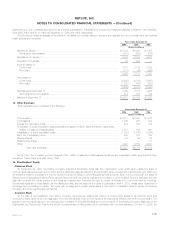
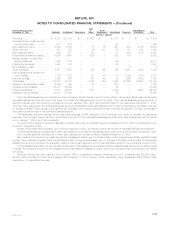
19. Business Segment Information
The Company provides insurance and financial services to customers in the United States, Canada, Central America, South America, Europe, South
Africa, Asia and Australia. The Company’s business is divided into six major segments: Individual Business, Institutional Business, Reinsurance, Auto &
Home, Asset Management and International. These segments are managed separately because they either provide different products and services,
require different strategies or have different technology requirements.
Individual Business offers a wide variety of individual insurance and investment products, including life insurance, annuities and mutual funds.
Institutional Business offers a broad range of group insurance and retirement and savings products and services, including group life insurance, non-
medical health insurance such as short and long-term disability, long-term care, and dental insurance, and other insurance products and services.
Reinsurance provides life reinsurance and international life and disability on a direct and reinsurance basis. Auto & Home provides insurance coverages,
including private passenger automobile, homeowners and personal excess liability insurance. Asset Management provides a broad variety of asset
management products and services to individuals and institutions. International provides life insurance, accident and health insurance, annuities and
retirement and savings products to both individuals and groups, and auto and homeowners coverage to individuals.
MetLife, Inc. F-33