MetLife 2000 Annual Report Download - page 21
Download and view the complete annual report
Please find page 21 of the 2000 MetLife annual report below. You can navigate through the pages in the report by either clicking on the pages listed below, or by using the keyword search tool below to find specific information within the annual report.-
 1
1 -
2
-
3
-
4
-
5
-
6
-
7
-
8
-
9
-
10
-
 11
11 -
 12
12 -
 13
13 -
 14
14 -
 15
15 -
 16
16 -
 17
17 -
 18
18 -
 19
19 -
 20
20 -
 21
21 -
 22
22 -
 23
23 -
 24
24 -
 25
25 -
 26
26 -
 27
27 -
 28
28 -
 29
29 -
 30
30 -
 31
31 -
32
-
33
-
34
-
35
-
36
-
37
-
38
-
39
-
40
-
41
-
42
-
43
-
44
-
45
-
46
-
47
-
48
-
49
-
50
-
51
-
52
-
53
-
54
-
55
-
56
-
57
-
58
-
59
-
60
-
61
-
62
-
63
-
64
-
65
-
66
-
67
-
68
 |
 |

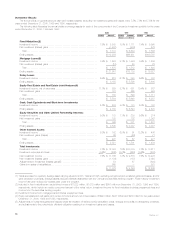
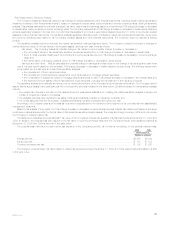
Investment Results
The annual yields on general account cash and invested assets, excluding net investment gains and losses, were 7.5%, 7.3% and 7.5% for the
years ended December 31, 2000, 1999 and 1998, respectively.
The following table illustrates the annual yields on average assets for each of the components of the Company’s investment portfolio for the years
ended December 31, 2000, 1999 and 1998:
2000 1999 1998
Yield(1) Amount Yield(1) Amount Yield(1) Amount
(Dollars in millions)
Fixed Maturities:(2)
Investment income *************************************************** 7.8% $ 8,538 7.5% $ 7,171 7.4% $ 6,990
Net investment (losses) gains ****************************************** (1,437) (538) 573
Total ************************************************************* $ 7,101 $ 6,633 $ 7,563
Ending assets ******************************************************* $112,979 $96,981 $100,767
Mortgage Loans:(3)
Investment income *************************************************** 7.9% $ 1,693 8.1% $ 1,484 8.5% $ 1,580
Net investment (losses) gains ****************************************** (18) 28 23
Total ************************************************************* $ 1,675 $ 1,512 $ 1,603
Ending assets ******************************************************* $ 21,951 $19,739 $ 16,827
Policy Loans:
Investment income *************************************************** 6.5% $ 515 6.1% $ 340 6.6% $ 387
Ending assets ******************************************************* $ 8,158 $ 5,598 $ 5,600
Equity Real Estate and Real Estate Joint Ventures:(4)
Investment income, net of expenses ************************************ 11.1% $ 629 9.7% $ 581 10.4% $ 687
Net investment gains ************************************************* 101 265 424
Total ************************************************************* $ 730 $ 846 $ 1,111
Ending assets ******************************************************* $ 5,504 $ 5,649 $ 6,287
Cash, Cash Equivalents and Short-term Investments:
Investment income *************************************************** 5.7% $ 288 4.2% $ 173 5.3% $ 187
Ending assets ******************************************************* $ 4,703 $ 5,844 $ 4,670
Equity Securities and Other Limited Partnership Interests:
Investment income *************************************************** 5.0% $ 183 7.1% $ 239 5.6% $ 274
Net investment gains ************************************************* 185 132 1,007
Total ************************************************************* $ 368 $ 371 $ 1,281
Ending assets ******************************************************* $ 3,845 $ 3,337 $ 3,387
Other Invested Assets:
Investment income *************************************************** 6.3% $ 162 6.0% $ 91 12.2% $ 406
Net investment gains (losses) ****************************************** 65 (24) 71
Total ************************************************************* $ 227 $ 67 $ 477
Ending assets ******************************************************* $ 2,821 $ 1,501 $ 1,484
Total Investments:
Investment income *************************************************** 7.7% $ 12,008 7.5% $10,079 7.7% $ 10,511
Investment expenses and fees ***************************************** (0.2%) (240) (0.2%) (263) (0.2%) (283)
Net investment income *********************************************** 7.5% $ 11,768 7.3% $ 9,816 7.5% $ 10,228
Net investment (losses) gains ****************************************** (1,104) (137) 2,098
Adjustments to investment (losses) gains(5) ****************************** 54 67 (608)
Gains from sales of subsidiaries **************************************** 660 — 531
$ 11,378 $ 9,746 $ 12,249
(1) Yields are based on quarterly average asset carrying values for 2000, 1999 and 1998, excluding recognized and unrealized gains and losses, and for
yield calculation purposes, average assets exclude collateral associated with the Company’s securities lending program. Fixed maturity investment
income has been reduced by rebates paid under the program.
(2) Included in fixed maturities are equity-linked notes of $1,232 million, $1,079 million and $916 million at December 31, 2000, 1999 and 1998,
respectively, which include an equity component as part of the notes’ return. Investment income for fixed maturities includes prepayment fees and
income from the securities lending program.
(3) Investment income from mortgage loans includes prepayment fees.
(4) Equity real estate and real estate joint venture income is shown net of depreciation of $224 million, $247 million and $282 million for the years ended
December 31, 2000, 1999 and 1998, respectively.
(5) Adjustments to investment gains and losses include amortization of deferred policy acquisition costs, charges and credits to participating contracts,
and adjustments to the policyholder dividend obligation resulting from investment gains and losses.
MetLife, Inc.
18