MetLife 2000 Annual Report Download - page 20
Download and view the complete annual report
Please find page 20 of the 2000 MetLife annual report below. You can navigate through the pages in the report by either clicking on the pages listed below, or by using the keyword search tool below to find specific information within the annual report.-
 1
1 -
2
-
3
-
4
-
5
-
6
-
7
-
8
-
9
-
 10
10 -
 11
11 -
 12
12 -
 13
13 -
 14
14 -
 15
15 -
 16
16 -
 17
17 -
 18
18 -
 19
19 -
 20
20 -
 21
21 -
 22
22 -
 23
23 -
 24
24 -
 25
25 -
 26
26 -
 27
27 -
 28
28 -
 29
29 -
 30
30 -
31
-
32
-
33
-
34
-
35
-
36
-
37
-
38
-
39
-
40
-
41
-
42
-
43
-
44
-
45
-
46
-
47
-
48
-
49
-
50
-
51
-
52
-
53
-
54
-
55
-
56
-
57
-
58
-
59
-
60
-
61
-
62
-
63
-
64
-
65
-
66
-
67
-
68
 |
 |

net purchases of investments resulted from a decrease in the reinvestment of sales proceeds as a result of the funding agreement exchange offer in
connection with the GenAmerica acquisition, as well as the purchase of the individual disability income business of Lincoln National Insurance Company.
Cash flows from investing activities increased by $5,840 million, $2,692 million and $3,769 million in 2000, 1999, and 1998, respectively, as a result of
increased volume in the securities lending program.
Net cash used in financing activities was $764 million, $1,988 million and $3,135 million for the years ended December 31, 2000, 1999 and 1998,
respectively. In 2000, the primary sources of cash from financing activities include cash proceeds from the Company’s initial public offering and
concurrent private placements in April 2000, as well as the issuance of mandatorily convertible securities in connection with the formation of MetLife
Capital Trust I. The primary uses of cash in financing activities include cash payments to eligible policyholders in connection with the demutualization, the
acquisition of treasury stock, Common Stock dividends, and the pay-down of short-term debt. Deposits to policyholders’ account balances exceeded
withdrawals by $599 million in 2000, as compared with withdrawals from policyholder account balances exceeding deposits of $2,222 million and
$2,345 million in 1999 and 1998, respectively. Short-term financings decreased by $3,114 million in 2000 compared with an increase of $623 million in
1999, while net additions to long-term debt were $88 million in 2000 compared with net reductions of $389 million in 1999.
The operating, investing and financing activities described above resulted in an increase (decrease) in cash and cash equivalents of $645 million,
$(512) million and $390 million for the years ended December 31, 2000, 1999 and 1998, respectively.
Insolvency Assessments
Most of the jurisdictions in which the Company is admitted to transact business require life insurers doing business within the jurisdiction to
participate in guaranty associations, which are organized to pay contractual benefits owed pursuant to insurance policies issued by impaired, insolvent or
failed life insurers. These associations levy assessments, up to prescribed limits, on all member insurers in a particular state on the basis of the
proportionate share of the premiums written by member insurers in the lines of business in which the impaired, insolvent or failed insurer engaged. Some
states permit member insurers to recover assessments paid through full or partial premium tax offsets. Assessments levied against the Company from
January 1, 1998 through December 31, 2000 aggregated $6 million. The Company maintained a liability of $63 million at December 31, 2000 for future
assessments in respect of currently impaired, insolvent or failed insurers.
Effects of Inflation
The Company does not believe that inflation has had a material effect on its consolidated results of operations, except insofar as inflation may affect
interest rates.
Investments
The Company had total cash and invested assets at December 31, 2000 of $160.0 billion. In addition, the Company had $70.3 billion held in its
separate accounts, for which the Company generally does not bear investment risk.
The Company’s primary investment objective is to maximize after-tax operating income consistent with acceptable risk parameters. The Company is
exposed to three primary sources of investment risk:
)credit risk, relating to the uncertainty associated with the continued ability of a given obligor to make timely payments of principal and interest;
)interest rate risk, relating to the market price and cash flow variability associated with changes in market interest rates; and
)market valuation risk for equity holdings.
The Company manages risk through in-house fundamental analysis of the underlying obligors, issuers, transaction structures and real estate
properties. The Company also manages credit risk and market valuation risk through industry and issuer diversification and asset allocation. For real
estate and agricultural assets, the Company manages credit risk and valuation risk through geographic, property type, and product type diversification
and asset allocation. The Company manages interest rate risk as part of its asset and liability management strategies, product design, such as the use of
market value adjustment features and surrender charges, and proactive monitoring and management of certain non-guaranteed elements of its products,
such as the resetting of credited interest and dividend rates for policies that permit such adjustments.
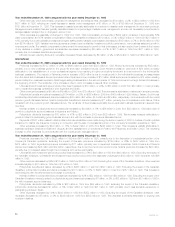
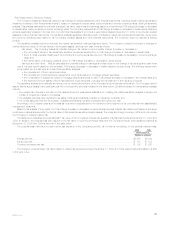
The following table summarizes the Company’s cash and invested assets at December 31, 2000 and December 31, 1999:
At December 31,
2000 1999
Carrying % of Carrying % of
Value Total Value Total
(Dollars in millions)
Fixed maturities available for sale at fair value *********************************************** $112,979 70.7% $ 96,981 69.9%
Mortgage loans on real estate************************************************************ 21,951 13.7 19,739 14.3
Policy loans *************************************************************************** 8,158 5.1 5,598 4.0
Equity real estate and real estate joint ventures ********************************************* 5,504 3.4 5,649 4.1
Cash and cash equivalents ************************************************************** 3,434 2.1 2,789 2.0
Equity securities and other limited partnership interests *************************************** 3,845 2.4 3,337 2.4
Other invested assets ****************************************************************** 2,821 1.8 1,501 1.1
Short-term investments ***************************************************************** 1,269 0.8 3,055 2.2
Total cash and invested assets*************************************************** $159,961 100.0% $138,649 100.0%
MetLife, Inc. 17