MetLife 2000 Annual Report Download - page 66
Download and view the complete annual report
Please find page 66 of the 2000 MetLife annual report below. You can navigate through the pages in the report by either clicking on the pages listed below, or by using the keyword search tool below to find specific information within the annual report.-
 1
1 -
2
-
3
-
4
-
5
-
6
-
7
-
8
-
9
-
10
-
11
-
12
-
13
-
14
-
15
-
16
-
17
-
18
-
19
-
20
-
21
-
22
-
23
-
24
-
25
-
26
-
27
-
28
-
29
-
30
-
31
-
32
-
33
-
34
-
35
-
36
-
37
-
38
-
39
-
40
-
41
-
42
-
43
-
44
-
45
-
46
-
47
-
48
-
49
-
50
-
51
-
52
-
53
-
54
-
55
-
 56
56 -
 57
57 -
 58
58 -
 59
59 -
 60
60 -
 61
61 -
 62
62 -
 63
63 -
 64
64 -
 65
65 -
 66
66 -
 67
67 -
 68
68
 |
 |

METLIFE, INC.
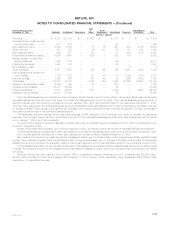
NOTES TO CONSOLIDATED FINANCIAL STATEMENTS — (Continued)
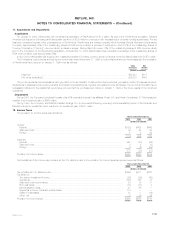
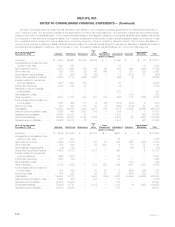
Auto
At or for the year ended & Asset Consolidation/
December 31, 1998 Individual Institutional Reinsurance Home Management International Corporate Elimination Total
(Dollars in millions)
Premiums *********************** $ 4,323 $ 5,159 $ — $1,403 $ — $ 618 $ — $ — $ 11,503
Universal life and investment-type
product policy fees ************* 817 475 — — — 68 — — 1,360
Net investment income************ 5,480 3,885 — 81 75 343 682 (318) 10,228
Other revenues ****************** 474 575 — 36 817 33 111 (52) 1,994
Net investment gains ************* 659 557 — 122 — 117 679 (113) 2,021
Policyholder benefits and claims **** 4,606 6,416 — 1,029 — 597 (10) — 12,638
Interest credited to policyholder
account balances ************** 1,423 1,199 — — — 89 — — 2,711
Policyholder dividends ************ 1,445 142 — — — 64 — — 1,651
Demutualization costs ************* ——— —— — 6 — 6
Other expenses****************** 2,577 1,613 — 386 799 352 2,601 (309) 8,019
Income (loss) before provision for
income taxes ****************** 1,702 1,281 — 227 93 77 (1,125) (174) 2,081
Net income (loss) **************** 1,069 846 — 161 49 56 (695) (143) 1,343
Total assets ********************* 103,614 88,741 — 2,763 1,164 3,432 20,852 (5,220) 215,346
Deferred policy acquisition costs **** 6,386 354 — 57 — 231 — — 7,028
Separate account assets ********** 23,013 35,029 — — — 26 — — 58,068
Policyholder liabilities ************** 71,571 49,406 — 1,477 — 2,043 1 (295) 124,203
Separate account liabilities ********* 23,013 35,029 — — — 26 — — 58,068
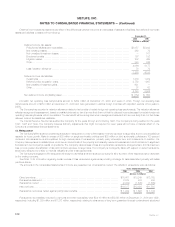
The Individual Business segment included an equity ownership interest in Nvest under the equity method of accounting. Nvest was included within
the Asset Management segment due to the types of products and strategies employed by the entity. The Individual Business segment’s equity in
earnings of Nvest, which is included in net investment income, was $30 million, $48 million and $49 million for the years ended December 31, 2000,
1999 and 1998, respectively. The Individual Business segment includes $538 million (after allocating $118 million to participating contracts) of the gain
on the sale of Nvest in 2000. As part of the GenAmerica acquisition, the Company acquired General American Life Insurance Company, the results of
which are included primarily in the Individual Business segment.
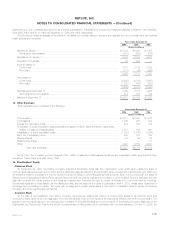
The Reinsurance segment includes the life reinsurance business of RGA, acquired in 2000, combined with Exeter, an ancillary life reinsurance
business of the Company. Exeter has been reported as a component of the Individual Business segment rather than as a separate segment for periods
prior to January 1, 2000 due to its immateriality.
The Auto & Home segment includes the standard personal lines property and casualty insurance operations of The St. Paul Companies which were
acquired in September, 1999.
As part of the GenAmerica acquisition, the Company acquired Conning, the results of which are included in the Asset Management segment.
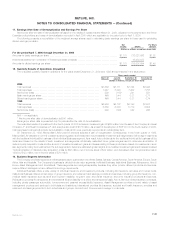
The International segment includes a $87 million gain resulting from the sale of a substantial portion of the Company’s Canadian operations in 1998.
The Corporate segment includes a $433 million gain resulting from the sale of MetLife Capital Holdings, Inc. in 1998.
Net investment income and net investment gains and losses are based upon the actual results of each segment’s specifically identifiable asset
portfolio. Other costs and operating costs were allocated to each of the segments based upon: (1) a review of the nature of such costs, (2) time studies
analyzing the amount of employee compensation costs incurred by each segment, and (3) cost estimates included in the Company’s product pricing.
The consolidation/elimination column includes the elimination of all intersegment amounts and the Individual Business segment’s ownership interest
in Nvest. The principal component of the intersegment amounts related to intersegment loans, which bore interest at rates commensurate with related
borrowings.
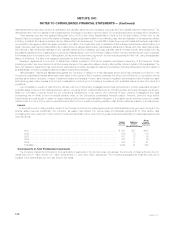
Revenues derived from any customer did not exceed 10% of consolidated revenues. Revenues from U.S. operations were $30,953 million,
$24,637 million and $25,643 million for the years ended December 31, 2000, 1999 and 1998, respectively, which represented 97%, 97% and 96%,
respectively, of consolidated revenues.
MetLife, Inc. F-35