MasterCard 2010 Annual Report Download - page 90
Download and view the complete annual report
Please find page 90 of the 2010 MasterCard annual report below. You can navigate through the pages in the report by either clicking on the pages listed below, or by using the keyword search tool below to find specific information within the annual report.-
 1
1 -
2
-
3
-
4
-
5
-
6
-
7
-
8
-
9
-
10
-
11
-
12
-
13
-
14
-
15
-
16
-
17
-
18
-
19
-
20
-
21
-
22
-
23
-
24
-
25
-
26
-
27
-
28
-
29
-
30
-
31
-
32
-
33
-
34
-
35
-
36
-
37
-
38
-
39
-
40
-
41
-
42
-
43
-
44
-
45
-
46
-
47
-
48
-
49
-
50
-
51
-
52
-
53
-
54
-
55
-
56
-
57
-
58
-
59
-
60
-
61
-
62
-
63
-
64
-
65
-
66
-
67
-
68
-
69
-
70
-
71
-
72
-
73
-
74
-
75
-
76
-
77
-
78
-
79
-
 80
80 -
 81
81 -
 82
82 -
 83
83 -
 84
84 -
 85
85 -
 86
86 -
 87
87 -
 88
88 -
 89
89 -
 90
90 -
 91
91 -
 92
92 -
 93
93 -
 94
94 -
 95
95 -
 96
96 -
 97
97 -
 98
98 -
 99
99 -
 100
100 -
101
-
102
-
103
-
104
-
105
-
106
-
107
-
108
-
109
-
110
-
111
-
112
-
113
-
114
-
115
-
116
-
117
-
118
-
119
-
120
-
121
-
122
-
123
-
124
-
125
-
126
-
127
-
128
-
129
-
130
-
131
-
132
-
133
-
134
-
135
-
136
-
137
-
138
-
139
-
140
-
141
-
142
-
143
-
144
-
145
-
146
-
147
-
148
-
149
-
150
-
151
-
152
-
153
-
154
-
155
-
156
-
157
-
158
-
159
-
160
-
161
-
162
 |
 |

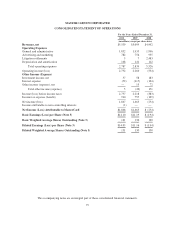
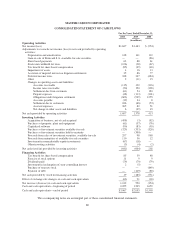
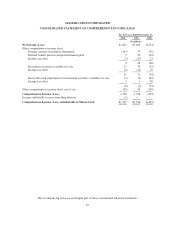
MASTERCARD INCORPORATED
CONSOLIDATED STATEMENT OF CASH FLOWS
For the Years Ended December 31,
2010 2009 2008
(in millions)
Operating Activities
Net income (loss) $1,847 $1,463 $ (254)
Adjustments to reconcile net income (loss) to net cash provided by operating
activities:
Depreciation and amortization 148 141 112
Gain on sale of Redecard S.A. available-for-sale securities — — (86)
Share based payments 63 88 61
Stock units withheld for taxes (126) (28) (67)
Tax benefit for share based compensation (85) (39) (48)
Impairment of assets 4 16 13
Accretion of imputed interest on litigation settlements 35 86 77
Deferred income taxes 248 337 (484)
Other 2 (11) 15
Changes in operating assets and liabilities:
Accounts receivable (115) 122 (116)
Income taxes receivable (50) 190 (198)
Settlement due from customers (61) 54 183
Prepaid expenses (48) (113) (101)
Obligations under litigation settlement (603) (939) 1,255
Accounts payable (19) 34 8
Settlement due to customers 186 (66) (53)
Accrued expenses 265 82 51
Net change in other assets and liabilities 6 (39) 45
Net cash provided by operating activities 1,697 1,378 413
Investing Activities
Acquisition of business, net of cash acquired (498) (3) (82)
Purchases of property, plant and equipment (61) (57) (76)
Capitalized software (90) (83) (95)
Purchases of investment securities available-for-sale (329) (333) (520)
Purchases of investment securities held-to-maturity — (300) —
Proceeds from sales of investment securities, available-for-sale 297 98 965
Proceeds from maturities of available-for-sale securities 110 36 12
Investment in nonmarketable equity investments (67) (18) —
Other investing activities (3) (4) (2)
Net cash (used in) provided by investing activities (641) (664) 202
Financing Activities
Tax benefit for share based compensation 85 39 48
Exercise of stock options 11 9 9
Dividends paid (79) (79) (79)
Investment in (redemption of) non-controlling interest 2 (5) —
Purchase of treasury stock — — (649)
Payment of debt — (149) (80)
Net cash provided by (used in) financing activities 19 (185) (751)
Effect of exchange rate changes on cash and cash equivalents (63) 21 (18)
Net increase (decrease) in cash and cash equivalents 1,012 550 (154)
Cash and cash equivalents—beginning of period 2,055 1,505 1,659
Cash and cash equivalents—end of period $3,067 $2,055 $1,505
The accompanying notes are an integral part of these consolidated financial statements.
80