MasterCard 2010 Annual Report Download - page 126
Download and view the complete annual report
Please find page 126 of the 2010 MasterCard annual report below. You can navigate through the pages in the report by either clicking on the pages listed below, or by using the keyword search tool below to find specific information within the annual report.-
 1
1 -
2
-
3
-
4
-
5
-
6
-
7
-
8
-
9
-
10
-
11
-
12
-
13
-
14
-
15
-
16
-
17
-
18
-
19
-
20
-
21
-
22
-
23
-
24
-
25
-
26
-
27
-
28
-
29
-
30
-
31
-
32
-
33
-
34
-
35
-
36
-
37
-
38
-
39
-
40
-
41
-
42
-
43
-
44
-
45
-
46
-
47
-
48
-
49
-
50
-
51
-
52
-
53
-
54
-
55
-
56
-
57
-
58
-
59
-
60
-
61
-
62
-
63
-
64
-
65
-
66
-
67
-
68
-
69
-
70
-
71
-
72
-
73
-
74
-
75
-
76
-
77
-
78
-
79
-
80
-
81
-
82
-
83
-
84
-
85
-
86
-
87
-
88
-
89
-
90
-
91
-
92
-
93
-
94
-
95
-
96
-
97
-
98
-
99
-
100
-
101
-
102
-
103
-
104
-
105
-
106
-
107
-
108
-
109
-
110
-
111
-
112
-
113
-
114
-
115
-
 116
116 -
 117
117 -
 118
118 -
 119
119 -
 120
120 -
 121
121 -
 122
122 -
 123
123 -
 124
124 -
 125
125 -
 126
126 -
 127
127 -
 128
128 -
 129
129 -
 130
130 -
 131
131 -
 132
132 -
 133
133 -
 134
134 -
 135
135 -
 136
136 -
137
-
138
-
139
-
140
-
141
-
142
-
143
-
144
-
145
-
146
-
147
-
148
-
149
-
150
-
151
-
152
-
153
-
154
-
155
-
156
-
157
-
158
-
159
-
160
-
161
-
162
 |
 |

MASTERCARD INCORPORATED
NOTES TO CONSOLIDATED FINANCIAL STATEMENTS—continued
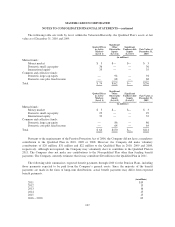
MasterCard. The expected volatility for options granted during 2008 was based on the average of the implied
volatility of MasterCard and the historical volatility of a group of companies that management believes is
generally comparable to MasterCard. The expected dividend yields were based on the Company’s expected
annual dividend rate on the date of grant.
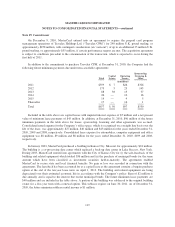
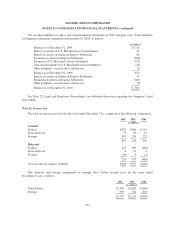
The following table summarizes the Company’s option activity for the year ended December 31, 2010:
Options
Weighted-Average
Exercise Price
Weighted Average
Remaining
Contractual Term
Aggregate
Intrinsic
Value
(in thousands) (in years) (in millions)
Outstanding at January 1, 2010 731 $120
Granted 182 $232
Exercised (152) $ 72
Forfeited/expired (25) $163
Outstanding at December 31, 2010 736 $156 7.4 $52
Exercisable at December 31, 2010 305 $111 6.4 $35
Options vested and expected to vest at
December 31, 20101433 $122 6.7 $44
1Includes options for participants that are eligible to retire and thus have fully earned their awards.
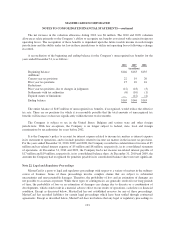
The total intrinsic value of options exercised during the years ended December 31, 2010, 2009 and 2008 was
$26 million, $22 million and $37 million, respectively. As of December 31, 2010, there was $12 million of total
unrecognized compensation cost related to non-vested options. The cost is expected to be recognized over a
weighted average period of 1.7 years.
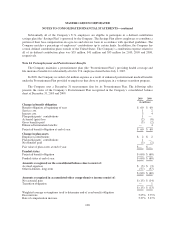
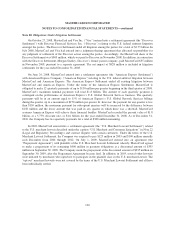
Restricted Stock Units
The following table summarizes the Company’s RSU activity for the year ended December 31, 2010:
Units
Weighted-Average
Grant-Date Fair
Value
Weighted Average
Remaining
Contractual Term
Aggregate
Intrinsic
Value
(in thousands) (in years) (in millions)
Outstanding at January 1, 2010 1,208 $ 71
Granted 186 $231
Converted (936) $ 44
Forfeited/expired (41) $174
Outstanding at December 31, 2010 417 $193 1.7 $93
RSUs vested at December 31, 2010131 $174 1.3 $ 7
1Includes RSUs for participants that are eligible to retire and thus have fully earned their awards.
The fair value of each RSU is the closing stock price on the New York Stock Exchange of the Company’s
Class A common stock on the date of grant. The weighted-average grant-date fair value of RSUs granted during
the years ended December 31, 2010, 2009 and 2008 was $231, $164 and $209, respectively. Upon vesting a
portion of the RSU award may be withheld to satisfy the minimum statutory withholding taxes. The remaining
116