MasterCard 2010 Annual Report Download - page 72
Download and view the complete annual report
Please find page 72 of the 2010 MasterCard annual report below. You can navigate through the pages in the report by either clicking on the pages listed below, or by using the keyword search tool below to find specific information within the annual report.-
 1
1 -
2
-
3
-
4
-
5
-
6
-
7
-
8
-
9
-
10
-
11
-
12
-
13
-
14
-
15
-
16
-
17
-
18
-
19
-
20
-
21
-
22
-
23
-
24
-
25
-
26
-
27
-
28
-
29
-
30
-
31
-
32
-
33
-
34
-
35
-
36
-
37
-
38
-
39
-
40
-
41
-
42
-
43
-
44
-
45
-
46
-
47
-
48
-
49
-
50
-
51
-
52
-
53
-
54
-
55
-
56
-
57
-
58
-
59
-
60
-
61
-
 62
62 -
 63
63 -
 64
64 -
 65
65 -
 66
66 -
 67
67 -
 68
68 -
 69
69 -
 70
70 -
 71
71 -
 72
72 -
 73
73 -
 74
74 -
 75
75 -
 76
76 -
 77
77 -
 78
78 -
 79
79 -
 80
80 -
 81
81 -
 82
82 -
83
-
84
-
85
-
86
-
87
-
88
-
89
-
90
-
91
-
92
-
93
-
94
-
95
-
96
-
97
-
98
-
99
-
100
-
101
-
102
-
103
-
104
-
105
-
106
-
107
-
108
-
109
-
110
-
111
-
112
-
113
-
114
-
115
-
116
-
117
-
118
-
119
-
120
-
121
-
122
-
123
-
124
-
125
-
126
-
127
-
128
-
129
-
130
-
131
-
132
-
133
-
134
-
135
-
136
-
137
-
138
-
139
-
140
-
141
-
142
-
143
-
144
-
145
-
146
-
147
-
148
-
149
-
150
-
151
-
152
-
153
-
154
-
155
-
156
-
157
-
158
-
159
-
160
-
161
-
162
 |
 |

an agreement (the “Prepayment Agreement”) with plaintiffs of the U.S. Merchant Lawsuit Settlement whereby
MasterCard agreed to make a prepayment of its remaining $400 million in payment obligations at a discounted
amount of $335 million. The Company paid $335 million on September 30, 2009, in accordance with the
Prepayment Agreement.
We recorded liabilities for these and certain other litigation settlements in 2010 and prior years. Total
liabilities for litigation settlements changed from December 31, 2008, as follows:
(in millions)
Balance as of December 31, 2008 ............................................ $1,736
Interest accretion on U.S. Merchant Lawsuit Settlement ........................... 21
Interest accretion on American Express Settlement ............................... 66
Payments on American Express Settlement ..................................... (600)
Payment on U.S. Merchant Lawsuit Settlement .................................. (335)
Gain on prepayment of U.S. Merchant Lawsuit Settlement ......................... (14)
Other payments, accruals and accretion, net ..................................... (4)
Balance as of December 31, 2009 ............................................ 870
Interest accretion on American Express Settlement ............................... 35
Payments on American Express Settlement ..................................... (600)
Other payments, accruals and accretion, net ..................................... (3)
Balance as of December 31, 2010 ............................................ $ 302
Depreciation and Amortization
Depreciation and amortization expenses increased $7 million, or 4.8%, and $29 million, or 26.2%, in 2010
and 2009, respectively. The net increases in depreciation and amortization expense in both years reflected
increased investments in data center equipment, capitalized software and leasehold and building improvements.
Additionally, in 2010, the increase included the amortization of intangible assets from the DataCash acquisition.
See Note 2 (Acquisition of DataCash Group plc) to the consolidated financial statements included in Part II,
Item 8. In 2009, the increase included depreciation on the Company’s global technology and operations center,
which was acquired under a capital lease arrangement in 2009. We expect that depreciation and amortization will
continue to increase as we continue to invest in property, plant and equipment and software.
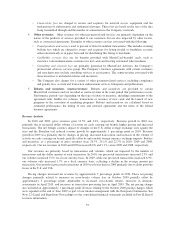
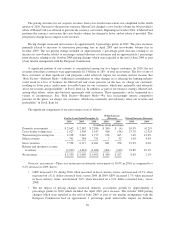
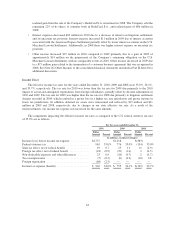
Other Income (Expense)
Other income (expense) is comprised primarily of investment income, interest expense and other gains and
losses. The components of other income (expense) for the years ended December 31, 2010, 2009 and 2008 were
as shown below:
For the Years Ended
December 31,
Dollar
Increase (Decrease)
Percent
Increase (Decrease)
2010 2009 2008 2010 2009 2010 2009
(in millions, except percentages)
Investment income, net ............. $ 57 $ 58 $183 $ (1) $(125) (0.7)% (68.5)%
Interest expense ................... (52) (115) (104) (63) 11 (55.1)% 11.1%
Other income (expense), net ......... — 15 72 (15) (57) (100.1)% (78.7)%
Total other income (expense) ........ $ 5 $ (42) $ 151 $ 47 $(193) 113.2% (127.8)%
• Investment income decreased $1 million in 2010, reflecting lower interest rates offset by increased cash
balances and realized gains on sales of investments. In 2009, investment income decreased $125 million
primarily due to lower interest income as a result of lower interest rates compared to 2008, and a
62