MasterCard 2010 Annual Report Download - page 109
Download and view the complete annual report
Please find page 109 of the 2010 MasterCard annual report below. You can navigate through the pages in the report by either clicking on the pages listed below, or by using the keyword search tool below to find specific information within the annual report.-
 1
1 -
2
-
3
-
4
-
5
-
6
-
7
-
8
-
9
-
10
-
11
-
12
-
13
-
14
-
15
-
16
-
17
-
18
-
19
-
20
-
21
-
22
-
23
-
24
-
25
-
26
-
27
-
28
-
29
-
30
-
31
-
32
-
33
-
34
-
35
-
36
-
37
-
38
-
39
-
40
-
41
-
42
-
43
-
44
-
45
-
46
-
47
-
48
-
49
-
50
-
51
-
52
-
53
-
54
-
55
-
56
-
57
-
58
-
59
-
60
-
61
-
62
-
63
-
64
-
65
-
66
-
67
-
68
-
69
-
70
-
71
-
72
-
73
-
74
-
75
-
76
-
77
-
78
-
79
-
80
-
81
-
82
-
83
-
84
-
85
-
86
-
87
-
88
-
89
-
90
-
91
-
92
-
93
-
94
-
95
-
96
-
97
-
98
-
 99
99 -
 100
100 -
 101
101 -
 102
102 -
 103
103 -
 104
104 -
 105
105 -
 106
106 -
 107
107 -
 108
108 -
 109
109 -
 110
110 -
 111
111 -
 112
112 -
 113
113 -
 114
114 -
 115
115 -
 116
116 -
 117
117 -
 118
118 -
 119
119 -
120
-
121
-
122
-
123
-
124
-
125
-
126
-
127
-
128
-
129
-
130
-
131
-
132
-
133
-
134
-
135
-
136
-
137
-
138
-
139
-
140
-
141
-
142
-
143
-
144
-
145
-
146
-
147
-
148
-
149
-
150
-
151
-
152
-
153
-
154
-
155
-
156
-
157
-
158
-
159
-
160
-
161
-
162
 |
 |

MASTERCARD INCORPORATED
NOTES TO CONSOLIDATED FINANCIAL STATEMENTS—continued
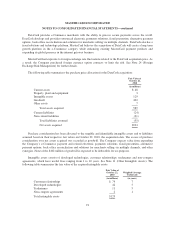
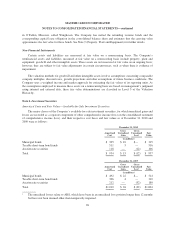
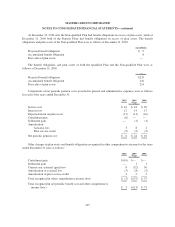
The table below summarizes the maturity ranges of the ARS portfolio, based on relative par value, as of
December 31, 2010:
Par
Amount
%of
Total
(in millions)
Due within 10 years $4 3%
Due year 11 through year 20 11 9%
Due year 21 through year 30 81 69%
Due after year 30 22 19%
Total $118 100%
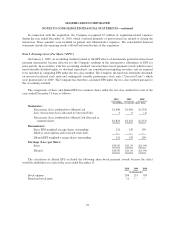
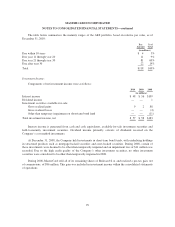
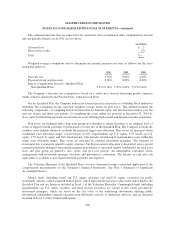
Investment Income:
Components of net investment income were as follows:
2010 2009 2008
(in millions)
Interest income $ 48 $ 56 $109
Dividend income — — 1
Investment securities available-for-sale:
Gross realized gains 9 2 88
Gross realized losses — — (4)
Other than temporary impairment on short-term bond fund — — (11)
Total investment income, net $ 57 $ 58 $183
Interest income is generated from cash and cash equivalents, available-for-sale investment securities and
held-to-maturity investment securities. Dividend income primarily consists of dividends received on the
Company’s cost method investments.
At December 31, 2008, the Company held investments in short-term bond funds, with underlying holdings
in structured products such as mortgage-backed securities and asset-backed securities. During 2008, certain of
these investments were deemed to be other-than-temporarily impaired and an impairment loss of $11 million was
recorded. Due to the high credit quality of the Company’s other investment securities, no other investment
securities were considered to be other-than-temporarily impaired in 2008.
During 2008, MasterCard sold all of its remaining shares of Redecard S.A. and realized a pre-tax gain, net
of commissions, of $86 million. This gain was included in investment income within the consolidated statements
of operations.
99