MasterCard 2010 Annual Report Download - page 65
Download and view the complete annual report
Please find page 65 of the 2010 MasterCard annual report below. You can navigate through the pages in the report by either clicking on the pages listed below, or by using the keyword search tool below to find specific information within the annual report.-
 1
1 -
2
-
3
-
4
-
5
-
6
-
7
-
8
-
9
-
10
-
11
-
12
-
13
-
14
-
15
-
16
-
17
-
18
-
19
-
20
-
21
-
22
-
23
-
24
-
25
-
26
-
27
-
28
-
29
-
30
-
31
-
32
-
33
-
34
-
35
-
36
-
37
-
38
-
39
-
40
-
41
-
42
-
43
-
44
-
45
-
46
-
47
-
48
-
49
-
50
-
51
-
52
-
53
-
54
-
 55
55 -
 56
56 -
 57
57 -
 58
58 -
 59
59 -
 60
60 -
 61
61 -
 62
62 -
 63
63 -
 64
64 -
 65
65 -
 66
66 -
 67
67 -
 68
68 -
 69
69 -
 70
70 -
 71
71 -
 72
72 -
 73
73 -
 74
74 -
 75
75 -
76
-
77
-
78
-
79
-
80
-
81
-
82
-
83
-
84
-
85
-
86
-
87
-
88
-
89
-
90
-
91
-
92
-
93
-
94
-
95
-
96
-
97
-
98
-
99
-
100
-
101
-
102
-
103
-
104
-
105
-
106
-
107
-
108
-
109
-
110
-
111
-
112
-
113
-
114
-
115
-
116
-
117
-
118
-
119
-
120
-
121
-
122
-
123
-
124
-
125
-
126
-
127
-
128
-
129
-
130
-
131
-
132
-
133
-
134
-
135
-
136
-
137
-
138
-
139
-
140
-
141
-
142
-
143
-
144
-
145
-
146
-
147
-
148
-
149
-
150
-
151
-
152
-
153
-
154
-
155
-
156
-
157
-
158
-
159
-
160
-
161
-
162
 |
 |
•Connectivity fees are charged to issuers and acquirers for network access, equipment and the
transmission of authorization and settlement messages. These fees are based on the size of the data
being transmitted through and the number of connections to the Company’s network.
4. Other revenues: Other revenues for other payment-related services are primarily dependent on the
nature of the products or services provided to our customers but are also impacted by other factors,
such as contractual agreements. Examples of other revenues are fees associated with the following:
•Fraud products and services used to prevent or detect fraudulent transactions. This includes warning
bulletin fees which are charged to issuers and acquirers for listing invalid or fraudulent accounts
either electronically or in paper form and for distributing this listing to merchants.
•Cardholder services fees are for benefits provided with MasterCard-branded cards, such as
insurance, telecommunications assistance for lost cards and locating automated teller machines.
•Consulting and research fees are primarily generated by MasterCard Advisors, the Company’s
professional advisory services group. The Company’s business agreements with certain customers
and merchants may include consulting services as an incentive. The contra-revenue associated with
these incentives is included in rebates and incentives.
• The Company also charges for a variety of other payment-related services, including compliance
and penalty fees, account and transaction enhancement services, holograms and publications.
5. Rebates and incentives (contra-revenue): Rebates and incentives are provided to certain
MasterCard customers and are recorded as contra-revenue in the same period that performance occurs.
Performance periods vary depending on the type of rebate or incentive, including commitments to the
agreement term, hurdles for volumes, transactions or issuance of new cards and the launch of new
programs or the execution of marketing programs. Rebates and incentives are calculated based on
estimated performance, the timing of new and renewed agreements and the terms of the related
business agreements.
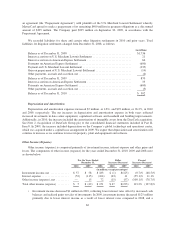
Revenue Analysis
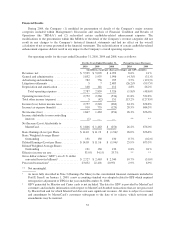
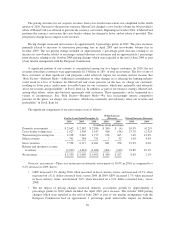
In 2010 and 2009, gross revenues grew 12.5% and 4.0%, respectively. Revenue growth in 2010 was
primarily due to increased dollar volume of activity on cards carrying our brands, higher pricing and increased
transactions. The net foreign currency impact of changes in the U.S. dollar average exchange rates against the
euro and the Brazilian real reduced revenue growth by approximately 1 percentage point in 2010. Revenue
growth in 2009 was primarily due to changes in pricing, increased transactions and increases in the volume of
activity on cards carrying our brands, partially offset by unfavorable foreign currency exchange impacts. Rebates
and incentives as a percentage of gross revenues were 26.7%, 24.1% and 22.7% in 2010, 2009 and 2008,
respectively. Our net revenues in 2010 and 2009 increased 8.6% and 2.1% versus 2009 and 2008, respectively.
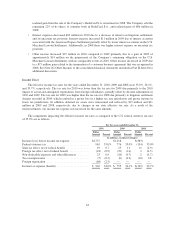
Our revenues are primarily based on transactions and volumes, which are impacted by the number of
transactions and the dollar amount of each transaction. In 2010, our processed transactions increased 2.9% and
our volumes increased 9.1% on a local currency basis. In 2009, while our processed transactions increased 6.9%,
our volumes only increased 1.7% on a local currency basis, reflecting a decline in the average amount per
transaction. Our growth in processed transactions in 2010 was lower than in 2009 primarily due to debit portfolio
losses in the U.S. and U.K.
Pricing changes increased net revenues by approximately 5 percentage points in 2010. These net pricing
changes primarily related to increases in cross-border volume fees in October 2009 partially offset by
approximately 3 percentage points attributable to increased cross-border rebates, increases in domestic
assessments in April 2010, and increases in transaction processing fees in April 2009. The net pricing change
also included an approximately 1 percentage point decrease relating to the October 2008 pricing changes which
were repealed at the end of June 2009 as part of our interim arrangement with the European Commission. See
Note 22 (Legal and Regulatory Proceedings) to the consolidated financial statements included in Part II, Item 8
for more information.
55