MasterCard 2010 Annual Report Download - page 132
Download and view the complete annual report
Please find page 132 of the 2010 MasterCard annual report below. You can navigate through the pages in the report by either clicking on the pages listed below, or by using the keyword search tool below to find specific information within the annual report.-
 1
1 -
2
-
3
-
4
-
5
-
6
-
7
-
8
-
9
-
10
-
11
-
12
-
13
-
14
-
15
-
16
-
17
-
18
-
19
-
20
-
21
-
22
-
23
-
24
-
25
-
26
-
27
-
28
-
29
-
30
-
31
-
32
-
33
-
34
-
35
-
36
-
37
-
38
-
39
-
40
-
41
-
42
-
43
-
44
-
45
-
46
-
47
-
48
-
49
-
50
-
51
-
52
-
53
-
54
-
55
-
56
-
57
-
58
-
59
-
60
-
61
-
62
-
63
-
64
-
65
-
66
-
67
-
68
-
69
-
70
-
71
-
72
-
73
-
74
-
75
-
76
-
77
-
78
-
79
-
80
-
81
-
82
-
83
-
84
-
85
-
86
-
87
-
88
-
89
-
90
-
91
-
92
-
93
-
94
-
95
-
96
-
97
-
98
-
99
-
100
-
101
-
102
-
103
-
104
-
105
-
106
-
107
-
108
-
109
-
110
-
111
-
112
-
113
-
114
-
115
-
116
-
117
-
118
-
119
-
120
-
121
-
 122
122 -
 123
123 -
 124
124 -
 125
125 -
 126
126 -
 127
127 -
 128
128 -
 129
129 -
 130
130 -
 131
131 -
 132
132 -
 133
133 -
 134
134 -
 135
135 -
 136
136 -
 137
137 -
 138
138 -
 139
139 -
 140
140 -
 141
141 -
 142
142 -
143
-
144
-
145
-
146
-
147
-
148
-
149
-
150
-
151
-
152
-
153
-
154
-
155
-
156
-
157
-
158
-
159
-
160
-
161
-
162
 |
 |

MASTERCARD INCORPORATED
NOTES TO CONSOLIDATED FINANCIAL STATEMENTS—continued
MasterCard has not provided for U.S. federal income and foreign withholding taxes on approximately $1.5
billion of undistributed earnings from non-U.S. subsidiaries as of December 31, 2010 because such earnings are
intended to be reinvested indefinitely outside of the United States. If these earnings were distributed, foreign tax
credits may become available under current law to reduce the resulting U.S. income tax liability; however, the
amount of the tax and credits is not practically determinable.
The provision for income taxes differs from the amount of income tax determined by applying the
appropriate statutory U.S. federal income tax rate to pretax income (loss) for the years ended December 31, as a
result of the following:
2010 2009 2008
Amount Percent Amount Percent Amount Percent
(in millions, except percentages)
Income (loss) before income tax expense $2,757 $2,218 $(383)
Federal statutory tax 965 35.0% 776 35.0% (134) 35.0%
State tax effect, net of federal benefit 19 0.7% 25 1.1% 11 (2.9)
Foreign tax effect, net of federal benefit (24) (0.9)% (22) (1.0)% 2 (0.5)
Non-deductible expenses and other differences 23 0.9% (18) (0.7)% 2 (0.7)
Tax exempt income (5) (0.2)% (6) (0.3)% (10) 2.8
Foreign repatriation (68) (2.5)% — — % — —
Income tax expense (benefit) $ 910 33.0% $ 755 34.1% $(129) 33.7%
Effective Income Tax Rate
The effective income tax rates for the years ended December 31, 2010, 2009 and 2008 were 33.0%, 34.1%
and 33.7%, respectively. The tax rate for 2010 was lower than the tax rate for 2009 due primarily to the impact of
actual and anticipated repatriations from foreign subsidiaries, partially offset by discrete adjustments in 2010 and
2009. The tax rate for 2009 was higher than the tax rate for 2008 due primarily to litigation settlement charges
recorded in 2008, which resulted in a pretax loss in a higher tax rate jurisdiction and pretax income in lower tax
rate jurisdictions.
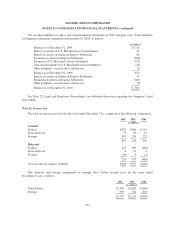
Deferred Taxes
Deferred tax assets and liabilities represent the expected future tax consequences of temporary differences
between the carrying amounts and the tax bases of assets and liabilities. The net deferred tax asset at
December 31 was comprised of the following:
Assets (Liabilities)
2010 2009
Current Non-current Current Non-current
(in millions)
Accrued liabilities (including litigation settlements) $133 $ 4 $240 $114
Deferred compensation and benefits 34 30 20 51
Stock based compensation 27 26 — 59
Intangible assets (6) (92) — (52)
Property, plant and equipment — (107) — (63)
State taxes and other credits 36 62 9 54
Other items (8) 26 (25) 33
Valuation allowance — (18) — (12)
$216 $ (69) $244 $184
122