MasterCard 2010 Annual Report Download - page 116
Download and view the complete annual report
Please find page 116 of the 2010 MasterCard annual report below. You can navigate through the pages in the report by either clicking on the pages listed below, or by using the keyword search tool below to find specific information within the annual report.-
 1
1 -
2
-
3
-
4
-
5
-
6
-
7
-
8
-
9
-
10
-
11
-
12
-
13
-
14
-
15
-
16
-
17
-
18
-
19
-
20
-
21
-
22
-
23
-
24
-
25
-
26
-
27
-
28
-
29
-
30
-
31
-
32
-
33
-
34
-
35
-
36
-
37
-
38
-
39
-
40
-
41
-
42
-
43
-
44
-
45
-
46
-
47
-
48
-
49
-
50
-
51
-
52
-
53
-
54
-
55
-
56
-
57
-
58
-
59
-
60
-
61
-
62
-
63
-
64
-
65
-
66
-
67
-
68
-
69
-
70
-
71
-
72
-
73
-
74
-
75
-
76
-
77
-
78
-
79
-
80
-
81
-
82
-
83
-
84
-
85
-
86
-
87
-
88
-
89
-
90
-
91
-
92
-
93
-
94
-
95
-
96
-
97
-
98
-
99
-
100
-
101
-
102
-
103
-
104
-
105
-
 106
106 -
 107
107 -
 108
108 -
 109
109 -
 110
110 -
 111
111 -
 112
112 -
 113
113 -
 114
114 -
 115
115 -
 116
116 -
 117
117 -
 118
118 -
 119
119 -
 120
120 -
 121
121 -
 122
122 -
 123
123 -
 124
124 -
 125
125 -
 126
126 -
127
-
128
-
129
-
130
-
131
-
132
-
133
-
134
-
135
-
136
-
137
-
138
-
139
-
140
-
141
-
142
-
143
-
144
-
145
-
146
-
147
-
148
-
149
-
150
-
151
-
152
-
153
-
154
-
155
-
156
-
157
-
158
-
159
-
160
-
161
-
162
 |
 |

MASTERCARD INCORPORATED
NOTES TO CONSOLIDATED FINANCIAL STATEMENTS—continued
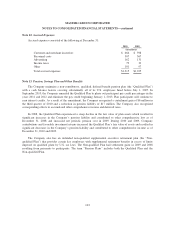
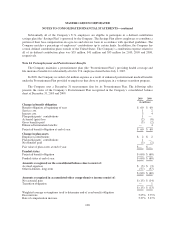
The estimated amounts that are expected to be amortized from accumulated other comprehensive income
into net periodic benefit cost in 2011 are as follows:
(in millions)
Actuarial loss $2
Prior service credit (2)
Total $—
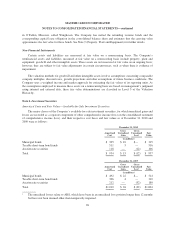
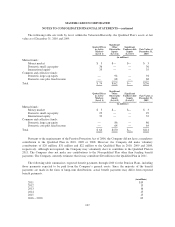
Weighted-average assumptions used to determine net periodic pension cost were as follows for the years
ended December 31:
2010 2009 2008
Discount rate 5.50% 6.00% 6.00%
Expected return on plan assets 8.00% 8.00% 8.00%
Rate of compensation increase—Qualified Plan/
Non-Qualified Plan 5.37%/5.00% 5.37%/5.00% 5.37%/5.00%
The Company’s discount rate assumption is based on a yield curve derived from high quality corporate
bonds, which is matched to the Pension Plans’ expected cash flows.
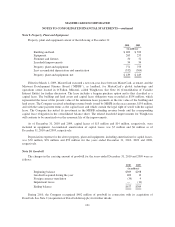
For the Qualified Plan, the Company utilized an actuarial practice referred to as a building block method to
determine the assumption for the expected weighted average return on plan assets. This method includes the
following components: (1) compiling historical return data for both the equity and fixed income markets over the
past ten, twenty and thirty year periods; (2) weighting the assets within our portfolio at December 31, 2010 by
class; and (3) identifying expected rate of return on assets utilizing both current and historical market experience.
Plan assets are managed with a long-term perspective intended to ensure that there is an adequate level of
assets to support benefit payments to participants over the life of the Qualified Plan. The Company periodically
conducts asset-liability studies to establish the preferred target asset allocation. Plan assets are managed within
established asset allocation ranges, toward targets of 40% large/medium cap U.S. equity, 15% small cap U.S.
equity, 15% non-U.S. equity and 30% fixed income, with periodic rebalancing to maintain plan assets within the
target asset allocation ranges. Plan assets are managed by external investment managers. The majority of
investment risk is primarily related to equity exposure, but this investment allocation is diversified across several
external investment managers. Investment manager performance is measured against benchmarks for each asset
class and peer group on quarterly, one-, three- and five-year periods. An independent consultant assists
management with investment manager selections and performance evaluations. The balance in cash and cash
equivalents is available to pay expected benefit payments and expenses.
The Valuation Hierarchy of the Qualified Plan’s assets is determined using a consistent application of the
categorization measurements for the Company’s financial instruments. See Note 1 (Summary of Significant
Accounting Policies).
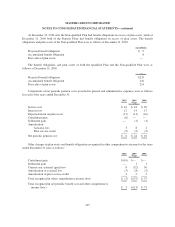
Mutual funds (including small cap U.S. equity securities and non-U.S. equity securities) are public
investment vehicles valued at quoted market prices, which represent the net asset value of the shares held by the
Qualified Plan and are therefore included in Level 1 of the Valuation Hierarchy. Commingled funds (including
large/medium cap U.S. equity securities and fixed income securities) are valued at unit values provided by
investment managers, which are based on the fair value of the underlying investments utilizing public
information, independent external valuation from third-party services or third-party advisors, and are therefore
included in Level 2 of the Valuation Hierarchy.
106