MasterCard 2010 Annual Report Download - page 70
Download and view the complete annual report
Please find page 70 of the 2010 MasterCard annual report below. You can navigate through the pages in the report by either clicking on the pages listed below, or by using the keyword search tool below to find specific information within the annual report.-
 1
1 -
2
-
3
-
4
-
5
-
6
-
7
-
8
-
9
-
10
-
11
-
12
-
13
-
14
-
15
-
16
-
17
-
18
-
19
-
20
-
21
-
22
-
23
-
24
-
25
-
26
-
27
-
28
-
29
-
30
-
31
-
32
-
33
-
34
-
35
-
36
-
37
-
38
-
39
-
40
-
41
-
42
-
43
-
44
-
45
-
46
-
47
-
48
-
49
-
50
-
51
-
52
-
53
-
54
-
55
-
56
-
57
-
58
-
59
-
 60
60 -
 61
61 -
 62
62 -
 63
63 -
 64
64 -
 65
65 -
 66
66 -
 67
67 -
 68
68 -
 69
69 -
 70
70 -
 71
71 -
 72
72 -
 73
73 -
 74
74 -
 75
75 -
 76
76 -
 77
77 -
 78
78 -
 79
79 -
 80
80 -
81
-
82
-
83
-
84
-
85
-
86
-
87
-
88
-
89
-
90
-
91
-
92
-
93
-
94
-
95
-
96
-
97
-
98
-
99
-
100
-
101
-
102
-
103
-
104
-
105
-
106
-
107
-
108
-
109
-
110
-
111
-
112
-
113
-
114
-
115
-
116
-
117
-
118
-
119
-
120
-
121
-
122
-
123
-
124
-
125
-
126
-
127
-
128
-
129
-
130
-
131
-
132
-
133
-
134
-
135
-
136
-
137
-
138
-
139
-
140
-
141
-
142
-
143
-
144
-
145
-
146
-
147
-
148
-
149
-
150
-
151
-
152
-
153
-
154
-
155
-
156
-
157
-
158
-
159
-
160
-
161
-
162
 |
 |

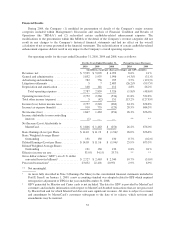
General and Administrative
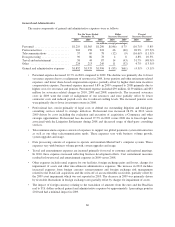
The major components of general and administrative expenses were as follows:
For the Years Ended
December 31,
Dollar
Increase (Decrease)
Percent
Increase (Decrease)
2010 2009 2008 2010 2009 2010 2009
(in millions, except percentages)
Personnel ........................ $1,219 $1,365 $1,290 $(146) $ 75 (10.7)% 5.8%
Professional fees .................. 204 158 218 46 (60) 28.9% (27.5)%
Telecommunications ............... 57 69 78 (12) (9) (16.6)% (11.5)%
Data processing ................... 90 86 78 4 8 4.8% 10.3%
Travel and entertainment ............ 58 44 87 14 (43) 31.7% (48.9)%
Other ........................... 224 213 245 11 (32) 4.7% (13.5)%
General and administrative expenses . . $1,852 $1,935 $1,996 $ (83) $(61) (4.3)% (3.1)%
• Personnel expense decreased 10.7% in 2010 compared to 2009. The decline was primarily due to lower
severance expense due to a realignment of resources in 2009, lower pension and other retirement-related
expenses, and lower share-based compensation expense, partially offset by higher short-term incentive
compensation expense. Personnel expense increased 5.8% in 2009 compared to 2008 primarily due to
higher costs for severance and pension. Personnel expense included $39 million, $139 million and $33
million for severance-related charges in 2010, 2009 and 2008, respectively. The increased severance
costs in 2009 were the result of realignment of our resources and were partially offset by lower
contractor costs and reduced payroll costs due to reduced staffing levels. The increased pension costs
were primarily due to lower investment returns in 2008.
• Professional fees consist primarily of legal costs to defend our outstanding litigation and third-party
consulting services related to strategic initiatives. Professional fees increased 28.9% in 2010 versus
2009 driven by costs including the evaluation and execution of acquisition, e-Commerce and other
strategic opportunities. Professional fees decreased 27.5% in 2009 versus 2008 due to lower legal fees
associated with the Litigation Settlements during 2008 and decreased usage of third-party consulting
services.
• Telecommunications expense consists of expenses to support our global payments system infrastructure
as well as our other telecommunication needs. These expenses vary with business volume growth,
system upgrades and usage.
• Data processing consists of expenses to operate and maintain MasterCard’s computer systems. These
expenses vary with business volume growth, system upgrades and usage.
• Travel and entertainment expenses are incurred primarily for travel to customer and regional meetings.
In 2010, these expenses increased reflecting business development efforts. Cost containment measures
resulted in lower travel and entertainment expenses in 2009 versus 2008.
• Other expenses include rental expense for our facilities, foreign exchange gains and losses, charges for
impairment of assets and other miscellaneous administrative expenses. The increase in 2010 includes
increased expenses from foreign currency remeasurement and foreign exchange risk management
related to the DataCash acquisition and the write-off of an uncollectible receivable, partially offset by
the 2009 asset impairment which was not repeated in 2010. The decrease in 2009 was primarily driven
by favorable fluctuations in foreign exchange rates partially offset by charges for impairment of assets.
• The impact of foreign currency relating to the translation of amounts from the euro and the Brazilian
real to U.S. dollars reduced general and administrative expenses by approximately 1 percentage point in
2010 and had a minimal impact in 2009.
60