MasterCard 2010 Annual Report Download - page 117
Download and view the complete annual report
Please find page 117 of the 2010 MasterCard annual report below. You can navigate through the pages in the report by either clicking on the pages listed below, or by using the keyword search tool below to find specific information within the annual report.-
 1
1 -
2
-
3
-
4
-
5
-
6
-
7
-
8
-
9
-
10
-
11
-
12
-
13
-
14
-
15
-
16
-
17
-
18
-
19
-
20
-
21
-
22
-
23
-
24
-
25
-
26
-
27
-
28
-
29
-
30
-
31
-
32
-
33
-
34
-
35
-
36
-
37
-
38
-
39
-
40
-
41
-
42
-
43
-
44
-
45
-
46
-
47
-
48
-
49
-
50
-
51
-
52
-
53
-
54
-
55
-
56
-
57
-
58
-
59
-
60
-
61
-
62
-
63
-
64
-
65
-
66
-
67
-
68
-
69
-
70
-
71
-
72
-
73
-
74
-
75
-
76
-
77
-
78
-
79
-
80
-
81
-
82
-
83
-
84
-
85
-
86
-
87
-
88
-
89
-
90
-
91
-
92
-
93
-
94
-
95
-
96
-
97
-
98
-
99
-
100
-
101
-
102
-
103
-
104
-
105
-
106
-
 107
107 -
 108
108 -
 109
109 -
 110
110 -
 111
111 -
 112
112 -
 113
113 -
 114
114 -
 115
115 -
 116
116 -
 117
117 -
 118
118 -
 119
119 -
 120
120 -
 121
121 -
 122
122 -
 123
123 -
 124
124 -
 125
125 -
 126
126 -
 127
127 -
128
-
129
-
130
-
131
-
132
-
133
-
134
-
135
-
136
-
137
-
138
-
139
-
140
-
141
-
142
-
143
-
144
-
145
-
146
-
147
-
148
-
149
-
150
-
151
-
152
-
153
-
154
-
155
-
156
-
157
-
158
-
159
-
160
-
161
-
162
 |
 |

MASTERCARD INCORPORATED
NOTES TO CONSOLIDATED FINANCIAL STATEMENTS—continued
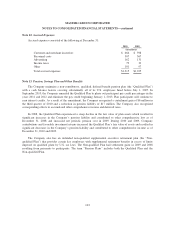
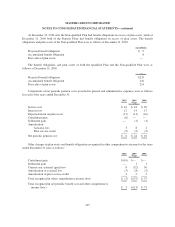
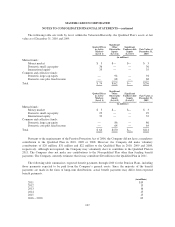
The following table sets forth by level, within the Valuation Hierarchy, the Qualified Plan’s assets at fair
value as of December 31, 2010 and 2009:
Quoted Prices
in Active
Markets
(Level 1)
Significant
Other
Observable
Inputs
(Level 2)
Significant
Unobservable
Inputs
(Level 3)
Fair Value at
December 31,
2010
(in millions)
Mutual funds:
Money market $ 3 $— $— $ 3
Domestic small cap equity 36 — — 36
International equity 35 — — 35
Common and collective funds:
Domestic large cap equity — 94 — 94
Domestic core plus fixed income — 68 — 68
Total $ 74 $162 $— $236
Quoted Prices
in Active
Markets
(Level 1)
Significant
Other
Observable
Inputs
(Level 2)
Significant
Unobservable
Inputs
(Level 3)
Fair Value at
December 31,
2009
(in millions)
Mutual funds:
Money market $ 3 $— $— $ 3
Domestic small cap equity 29 — — 29
International equity 32 — — 32
Common and collective funds:
Domestic large cap equity — 86 — 86
Domestic core plus fixed income — 64 — 64
Total $ 64 $150 $— $214
Pursuant to the requirements of the Pension Protection Act of 2006, the Company did not have a mandatory
contribution to the Qualified Plan in 2010, 2009 or 2008. However, the Company did make voluntary
contributions of $20 million, $31 million and $22 million to the Qualified Plan in 2010, 2009 and 2008,
respectively. Although not required, the Company may voluntarily elect to contribute to the Qualified Plan in
2011. The Company does not make any contributions to the Non-qualified Plan other than funding benefit
payments. The Company currently estimates that it may contribute $20 million to the Qualified Plan in 2011.
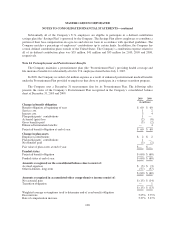
The following table summarizes expected benefit payments through 2020 for the Pension Plans, including
those payments expected to be paid from the Company’s general assets. Since the majority of the benefit
payments are made in the form of lump-sum distributions, actual benefit payments may differ from expected
benefit payments.
(in millions)
2011 $19
2012 15
2013 16
2014 15
2015 13
2016 – 2020 63
107