MasterCard 2010 Annual Report Download - page 59
Download and view the complete annual report
Please find page 59 of the 2010 MasterCard annual report below. You can navigate through the pages in the report by either clicking on the pages listed below, or by using the keyword search tool below to find specific information within the annual report.-
 1
1 -
2
-
3
-
4
-
5
-
6
-
7
-
8
-
9
-
10
-
11
-
12
-
13
-
14
-
15
-
16
-
17
-
18
-
19
-
20
-
21
-
22
-
23
-
24
-
25
-
26
-
27
-
28
-
29
-
30
-
31
-
32
-
33
-
34
-
35
-
36
-
37
-
38
-
39
-
40
-
41
-
42
-
43
-
44
-
45
-
46
-
47
-
48
-
 49
49 -
 50
50 -
 51
51 -
 52
52 -
 53
53 -
 54
54 -
 55
55 -
 56
56 -
 57
57 -
 58
58 -
 59
59 -
 60
60 -
 61
61 -
 62
62 -
 63
63 -
 64
64 -
 65
65 -
 66
66 -
 67
67 -
 68
68 -
 69
69 -
70
-
71
-
72
-
73
-
74
-
75
-
76
-
77
-
78
-
79
-
80
-
81
-
82
-
83
-
84
-
85
-
86
-
87
-
88
-
89
-
90
-
91
-
92
-
93
-
94
-
95
-
96
-
97
-
98
-
99
-
100
-
101
-
102
-
103
-
104
-
105
-
106
-
107
-
108
-
109
-
110
-
111
-
112
-
113
-
114
-
115
-
116
-
117
-
118
-
119
-
120
-
121
-
122
-
123
-
124
-
125
-
126
-
127
-
128
-
129
-
130
-
131
-
132
-
133
-
134
-
135
-
136
-
137
-
138
-
139
-
140
-
141
-
142
-
143
-
144
-
145
-
146
-
147
-
148
-
149
-
150
-
151
-
152
-
153
-
154
-
155
-
156
-
157
-
158
-
159
-
160
-
161
-
162
 |
 |
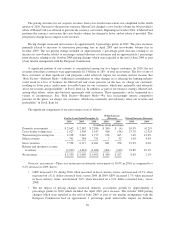
approximately 1 percentage point in 2010. Our net revenues increased 2.1% in 2009, primarily due to increased
transactions, pricing changes and increases in the volume of activity on cards carrying our brands, partially offset
by approximately 2 percentage points relating to the U.S. dollar average exchange rates strengthening versus the
euro and Brazilian real. Historically, we experienced greater growth in net revenues than the revenue growth in
2009. The lower growth rate reflected the impact of the global economic environment in 2009, which negatively
affected our customers and their cardholders.
Our revenues depend heavily upon the overall level of consumer, business and government spending.
Changes in cardholder spending behavior, influenced by economic environments, have impacted and may
continue to impact our ability to grow our revenues. Our revenues are primarily based on transactions and
volumes, which are impacted by the number of transactions and the dollar amount of each transaction. In 2010,
our processed transactions increased 2.9% and our volumes increased 9.1% on a local currency basis. In 2009,
while our processed transactions increased 6.9%, our volumes only increased 1.7% on a local currency basis,
reflecting a decline in the average amount per transaction. Our growth in processed transactions in 2010 was
lower than in 2009 primarily due to debit portfolio losses in the U.S. and U.K.
During 2010, net pricing actions contributed approximately 5 percentage points to our net revenue growth.
These net pricing actions included the effects of price increases during 2009 and 2010, which were partially
offset by an increase in cross-border rebates and the repeal of pricing relating to our interim arrangement with the
European Commission. During 2009, net pricing actions contributed approximately 6 percentage points to our
net revenue growth. These net pricing actions included price increases in 2009 partially offset by an increase in
cross-border rebates and the repeal of pricing relating to our interim arrangement with the European
Commission. Overall, net revenue growth in 2010 and 2009 was moderated by an increase in rebates and
incentives relating to customer and merchant agreement activity. Rebates and incentives as a percentage of gross
revenues were 26.7%, 24.1% and 22.7% in 2010, 2009 and 2008, respectively.
Our operating expenses decreased 1.8% in 2010 compared to 2009, primarily due to lower general and
administrative expenses, partially offset by increased advertising and marketing expenses. The decline in general
and administrative expenses was primarily due to lower personnel expenses, partially offset by increased
professional fees. The net foreign currency impact of changes in the U.S. dollar average exchange rates against
the euro and the Brazilian real reduced expenses by approximately 1 percentage point in 2010.
Operating expenses decreased 48.6% in 2009 compared to 2008, primarily due to lower litigation
settlements. Excluding the impact of the Litigation Settlements identified in the reconciliation table included in
“—Operating Expenses,” operating expenses declined 6.9% in 2009 compared to 2008. In 2009, we realigned
our resources and implemented contingency plans in response to the global economic and business environment
at that time.
Our ratios of operating income (loss) as a percentage of net revenues, or operating margins, were 49.7% in
2010 versus 44.3% in 2009 and (10.7%) in 2008. In 2008, excluding the impact of the Litigation Settlements, the
operating margin was 39.0%.
Other income (expense) varies depending on activities not core to our operations. Other income (expense)
increased in 2010 from 2009, including the effects of decreased interest expense on litigation settlements and
uncertain tax positions. In 2009, we did not have significant activity comparable to gains realized in 2008. As to
income tax expense (benefit), effective income tax rates were 33.0%, 34.1% and 33.7% for the years ended
December 31, 2010, 2009 and 2008, respectively.
On August 19, 2010, MasterCard entered into an agreement to acquire all the outstanding shares of
DataCash Group plc (“DataCash”), a European payment service provider. Pursuant to the terms of the acquisition
agreement, the Company acquired DataCash in cash on October 22, 2010 at a purchase price of 334 million U.K.
pound sterling, or $534 million. DataCash provides e-Commerce merchants with the ability to process secure
49