MasterCard 2010 Annual Report Download - page 2
Download and view the complete annual report
Please find page 2 of the 2010 MasterCard annual report below. You can navigate through the pages in the report by either clicking on the pages listed below, or by using the keyword search tool below to find specific information within the annual report.-
 1
1 -
 2
2 -
 3
3 -
 4
4 -
 5
5 -
 6
6 -
 7
7 -
 8
8 -
 9
9 -
 10
10 -
 11
11 -
 12
12 -
 13
13 -
14
-
15
-
16
-
17
-
18
-
19
-
20
-
21
-
22
-
23
-
24
-
25
-
26
-
27
-
28
-
29
-
30
-
31
-
32
-
33
-
34
-
35
-
36
-
37
-
38
-
39
-
40
-
41
-
42
-
43
-
44
-
45
-
46
-
47
-
48
-
49
-
50
-
51
-
52
-
53
-
54
-
55
-
56
-
57
-
58
-
59
-
60
-
61
-
62
-
63
-
64
-
65
-
66
-
67
-
68
-
69
-
70
-
71
-
72
-
73
-
74
-
75
-
76
-
77
-
78
-
79
-
80
-
81
-
82
-
83
-
84
-
85
-
86
-
87
-
88
-
89
-
90
-
91
-
92
-
93
-
94
-
95
-
96
-
97
-
98
-
99
-
100
-
101
-
102
-
103
-
104
-
105
-
106
-
107
-
108
-
109
-
110
-
111
-
112
-
113
-
114
-
115
-
116
-
117
-
118
-
119
-
120
-
121
-
122
-
123
-
124
-
125
-
126
-
127
-
128
-
129
-
130
-
131
-
132
-
133
-
134
-
135
-
136
-
137
-
138
-
139
-
140
-
141
-
142
-
143
-
144
-
145
-
146
-
147
-
148
-
149
-
150
-
151
-
152
-
153
-
154
-
155
-
156
-
157
-
158
-
159
-
160
-
161
-
162
 |
 |

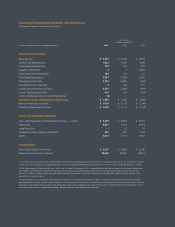
Summary Consolidated Financial and Other Data
All fi gures throughout this report in U.S. dollars
(1) As more fully described in Note 3 (Earnings Per Share) to the consolidated financial statements included in the Form 10-K, on January 1, 2009,
a new accounting standard was adopted related to EPS which required retrospective adjustment of EPS for the year ended December 31, 2008.
(2) GDV generated by Maestro and Cirrus cards is not included. The data for GDV is provided by MasterCard customers and includes information
with respect to MasterCard-branded transactions that are not processed by MasterCard and for which MasterCard does not earn significant
revenues. All data is subject to revision and amendment by MasterCard’s customers subsequent to the date of its release, which revisions and
amendments may be material.
(3) Data represents all transactions processed by MasterCard, including PIN-based online debit transactions, regardless of brand. The numbers
were updated in 2009 to exclude a small number of certain processed transactions initiated with cards that do not bear our brands, and in 2010 to
exclude a small number of transactions that were processed by both of MasterCard’s processing systems. All prior period data have been revised
to be consistent with this revised methodology. Revenue was not impacted by these changes.
For the Years
Ended December 31
(in millions except per share and operating data) 2010 2009 2008
Statement of Operations
Revenues, Net $ 5,539 $ 5,099 $ 4,992
General and Administrative 1,852 1,935 1,996
Advertising and Marketing 782 756 935
Litigation Settlements 57 2,483
Depreciation and Amortization 148 141 112
Total Operating Expenses 2,787 2,839 5,526
Operating Income (Loss) 2,752 2,260 (534)
Total Other Income (Expense) 5(42) 151
Income (Loss) before Income Taxes 2,757 2,218 (383)
Income Tax Expense (Benefi t) 910 755 (129)
Income Attributable to Non-Controlling Interests (1) — —
Net Income (Loss) Attributable to MasterCard $ 1,846 $ 1,463 $ (254)
Basic Earnings (Loss) per Share $ 14.10 $ 11.19 $ (1.94)1
Diluted Earnings (Loss) per Share $ 14.05 $ 11.16 $ (1.94)1
Balance Sheet Data (at period end)
Cash, Cash Equivalents and Investment Securities — Current $ 4,198 $ 2,879 $ 2,093
Total Assets 8,837 7,470 6,476
Long-Term Debt —22 19
Obligations Under Litigation Settlements 302 870 1,736
Equity 5,216 3,512 1,932
Operating Data
Gross Dollar Volume (in billions)
2 $ 2,727 $ 2,463 $ 2,540
Processed Transactions (in millions)
3 23,052 22,401 20,951