MasterCard 2010 Annual Report Download - page 62
Download and view the complete annual report
Please find page 62 of the 2010 MasterCard annual report below. You can navigate through the pages in the report by either clicking on the pages listed below, or by using the keyword search tool below to find specific information within the annual report.-
 1
1 -
2
-
3
-
4
-
5
-
6
-
7
-
8
-
9
-
10
-
11
-
12
-
13
-
14
-
15
-
16
-
17
-
18
-
19
-
20
-
21
-
22
-
23
-
24
-
25
-
26
-
27
-
28
-
29
-
30
-
31
-
32
-
33
-
34
-
35
-
36
-
37
-
38
-
39
-
40
-
41
-
42
-
43
-
44
-
45
-
46
-
47
-
48
-
49
-
50
-
51
-
 52
52 -
 53
53 -
 54
54 -
 55
55 -
 56
56 -
 57
57 -
 58
58 -
 59
59 -
 60
60 -
 61
61 -
 62
62 -
 63
63 -
 64
64 -
 65
65 -
 66
66 -
 67
67 -
 68
68 -
 69
69 -
 70
70 -
 71
71 -
 72
72 -
73
-
74
-
75
-
76
-
77
-
78
-
79
-
80
-
81
-
82
-
83
-
84
-
85
-
86
-
87
-
88
-
89
-
90
-
91
-
92
-
93
-
94
-
95
-
96
-
97
-
98
-
99
-
100
-
101
-
102
-
103
-
104
-
105
-
106
-
107
-
108
-
109
-
110
-
111
-
112
-
113
-
114
-
115
-
116
-
117
-
118
-
119
-
120
-
121
-
122
-
123
-
124
-
125
-
126
-
127
-
128
-
129
-
130
-
131
-
132
-
133
-
134
-
135
-
136
-
137
-
138
-
139
-
140
-
141
-
142
-
143
-
144
-
145
-
146
-
147
-
148
-
149
-
150
-
151
-
152
-
153
-
154
-
155
-
156
-
157
-
158
-
159
-
160
-
161
-
162
 |
 |

Financial Results
During 2009, the Company: (1) modified its presentation of details of the Company’s major revenue
categories included within Management’s Discussion and Analysis of Financial Condition and Results of
Operations (the “MD&A”) and (2) reclassified certain cardholder-related enhancement expenses. The
modifications to the presentation within this MD&A of the detail of the Company’s revenue categories did not
result in any changes to the Company’s historical financial statements and had no effect on the overall
calculation of net revenue presented in the financial statements. The reclassification of certain cardholder-related
enhancement expenses did not result in any impact to the Company’s overall operating expenses.
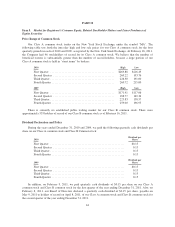
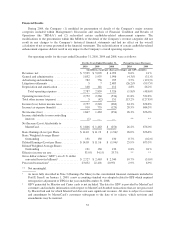
Our operating results for the years ended December 31, 2010, 2009 and 2008, were as follows:
For the Years Ended December 31, Percent Increase (Decrease)
2010 2009 2008 2010 2009
(in millions, except per share, percentages and GDV amounts)
Revenues, net ........................... $ 5,539 $ 5,099 $ 4,992 8.6% 2.1%
General and administrative ................ 1,852 1,935 1,996 (4.3)% (3.1)%
Advertising and marketing ................. 782 756 935 3.5% (19.2)%
Litigation settlements ..................... 5 7 2,483 (26.2)% (99.7)%
Depreciation and amortization .............. 148 141 112 4.8% 26.2%
Total operating expenses .............. 2,787 2,839 5,526 (1.8)% (48.6)%
Operating income (loss) ................... 2,752 2,260 (534) 21.8% 522.8%
Total other income (expense) ............... 5 (42) 151 113.2% (127.8)%
Income (loss) before income taxes .......... 2,757 2,218 (383) 24.3% 678.8%
Income tax expense (benefit) ............... 910 755 (129) 20.5% 684.3%
Net income (loss) ........................ 1,847 1,463 (254) 26.3% 676.0%
Income attributable to non-controlling
interests ............................. (1) — — ** **
Net Income (Loss) Attributable to
MasterCard ........................... $ 1,846 $ 1,463 $ (254) 26.2% 676.0%
Basic Earnings (Loss) per Share ............ $14.10 $ 11.19 $ (1.94)126.0% 676.8%
Basic Weighted Average Shares
Outstanding .......................... 131 130 130 0.7% (0.2)%
Diluted Earnings (Loss) per Share ........... $14.05 $ 11.16 $ (1.94)125.9% 675.3%
Diluted Weighted Average Shares
Outstanding .......................... 131 130 130 0.8% 0.1%
Effective income tax rate .................. 33.0% 34.1% 33.7% ** **
Gross dollar volume (“GDV”) on a U.S. dollar
converted basis (in billions)2............. $ 2,727 $ 2,463 $ 2,540 10.7% (3.0)%
Processed transactions3................... 23,052 22,401 20,951 2.9% 6.9%
** Not meaningful.
1As more fully described in Note 3 (Earnings Per Share) to the consolidated financial statements included in
Part II, Item 8, on January 1, 2009, a new accounting standard was adopted related to EPS which required
retrospective adjustment of EPS for the year ended December 31, 2008.
2GDV generated by Maestro and Cirrus cards is not included. The data for GDV is provided by MasterCard
customers and includes information with respect to MasterCard-branded transactions that are not processed
by MasterCard and for which MasterCard does not earn significant revenues. All data is subject to revision
and amendment by MasterCard’s customers subsequent to the date of its release, which revisions and
amendments may be material.
52