MasterCard 2010 Annual Report Download - page 27
Download and view the complete annual report
Please find page 27 of the 2010 MasterCard annual report below. You can navigate through the pages in the report by either clicking on the pages listed below, or by using the keyword search tool below to find specific information within the annual report.-
 1
1 -
2
-
3
-
4
-
5
-
6
-
7
-
8
-
9
-
10
-
11
-
12
-
13
-
14
-
15
-
16
-
 17
17 -
 18
18 -
 19
19 -
 20
20 -
 21
21 -
 22
22 -
 23
23 -
 24
24 -
 25
25 -
 26
26 -
 27
27 -
 28
28 -
 29
29 -
 30
30 -
 31
31 -
 32
32 -
 33
33 -
 34
34 -
 35
35 -
 36
36 -
 37
37 -
38
-
39
-
40
-
41
-
42
-
43
-
44
-
45
-
46
-
47
-
48
-
49
-
50
-
51
-
52
-
53
-
54
-
55
-
56
-
57
-
58
-
59
-
60
-
61
-
62
-
63
-
64
-
65
-
66
-
67
-
68
-
69
-
70
-
71
-
72
-
73
-
74
-
75
-
76
-
77
-
78
-
79
-
80
-
81
-
82
-
83
-
84
-
85
-
86
-
87
-
88
-
89
-
90
-
91
-
92
-
93
-
94
-
95
-
96
-
97
-
98
-
99
-
100
-
101
-
102
-
103
-
104
-
105
-
106
-
107
-
108
-
109
-
110
-
111
-
112
-
113
-
114
-
115
-
116
-
117
-
118
-
119
-
120
-
121
-
122
-
123
-
124
-
125
-
126
-
127
-
128
-
129
-
130
-
131
-
132
-
133
-
134
-
135
-
136
-
137
-
138
-
139
-
140
-
141
-
142
-
143
-
144
-
145
-
146
-
147
-
148
-
149
-
150
-
151
-
152
-
153
-
154
-
155
-
156
-
157
-
158
-
159
-
160
-
161
-
162
 |
 |

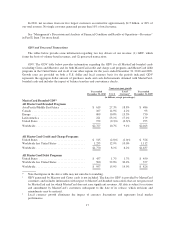
In 2010, net revenues from our five largest customers accounted for approximately $1.5 billion, or 28% of
our total revenue. No single customer generated greater than 10% of total revenue.
See “Management’s Discussion and Analysis of Financial Condition and Results of Operations—Revenues”
in Part II, Item 7 for more detail.
GDV and Processed Transactions
The tables below provide some information regarding two key drivers of our revenue: (1) GDV, which
forms the basis of volume-based revenues, and (2) processed transactions.
GDV. The GDV table below provides information regarding the GDV for all MasterCard-branded cards
(excluding Cirrus and Maestro) and for both MasterCard credit and charge card programs and MasterCard debit
programs in the United States and in all of our other regions for the years ended December 31, 2010 and 2009.
Growth rates are provided on both a U.S. dollar and local currency basis for the periods indicated. GDV
represents the aggregate dollar amount of purchases made and cash disbursements obtained with MasterCard-
branded cards and includes the impact of balance transfers and convenience checks.
Year ended
December 31, 2010
Year-over-year growth
U.S. $
Local
Currency2
Year ended
December 31, 2009
(in billions, except percentages)
MasterCard Branded GDV1
All MasterCard Branded Programs
Asia/Pacific/Middle East/Africa ................. $ 619 27.3% 18.8% $ 486
Canada ..................................... 107 14.9% 4.2% 93
Europe ..................................... 809 10.8% 13.5% 730
Latin America ............................... 221 23.1% 17.4% 179
United States ................................ 972 (0.3)% (0.3)% 975
Worldwide .................................. $2,727 10.7% 9.1% $2,463
All MasterCard Credit and Charge Programs
United States ................................ $ 515 (2.0)% (2.0)% $ 526
Worldwide less United States ................... 1,255 12.9% 10.0% 1,112
Worldwide .................................. $1,770 8.1% 6.2% $1,637
All MasterCard Debit Programs
United States ................................ $ 457 1.7% 1.7% $ 450
Worldwide less United States ................... 500 32.8% 30.4% 377
Worldwide .................................. $ 957 15.9% 14.9% $ 826
* Note that figures in the above table may not sum due to rounding.
1GDV generated by Maestro and Cirrus cards is not included. The data for GDV is provided by MasterCard
customers and includes information with respect to MasterCard-branded transactions that are not processed
by MasterCard and for which MasterCard does not earn significant revenues. All data is subject to revision
and amendment by MasterCard’s customers subsequent to the date of its release, which revisions and
amendments may be material.
2Local currency growth eliminates the impact of currency fluctuations and represents local market
performance.
17