MasterCard 2010 Annual Report Download - page 67
Download and view the complete annual report
Please find page 67 of the 2010 MasterCard annual report below. You can navigate through the pages in the report by either clicking on the pages listed below, or by using the keyword search tool below to find specific information within the annual report.-
 1
1 -
2
-
3
-
4
-
5
-
6
-
7
-
8
-
9
-
10
-
11
-
12
-
13
-
14
-
15
-
16
-
17
-
18
-
19
-
20
-
21
-
22
-
23
-
24
-
25
-
26
-
27
-
28
-
29
-
30
-
31
-
32
-
33
-
34
-
35
-
36
-
37
-
38
-
39
-
40
-
41
-
42
-
43
-
44
-
45
-
46
-
47
-
48
-
49
-
50
-
51
-
52
-
53
-
54
-
55
-
56
-
 57
57 -
 58
58 -
 59
59 -
 60
60 -
 61
61 -
 62
62 -
 63
63 -
 64
64 -
 65
65 -
 66
66 -
 67
67 -
 68
68 -
 69
69 -
 70
70 -
 71
71 -
 72
72 -
 73
73 -
 74
74 -
 75
75 -
 76
76 -
 77
77 -
78
-
79
-
80
-
81
-
82
-
83
-
84
-
85
-
86
-
87
-
88
-
89
-
90
-
91
-
92
-
93
-
94
-
95
-
96
-
97
-
98
-
99
-
100
-
101
-
102
-
103
-
104
-
105
-
106
-
107
-
108
-
109
-
110
-
111
-
112
-
113
-
114
-
115
-
116
-
117
-
118
-
119
-
120
-
121
-
122
-
123
-
124
-
125
-
126
-
127
-
128
-
129
-
130
-
131
-
132
-
133
-
134
-
135
-
136
-
137
-
138
-
139
-
140
-
141
-
142
-
143
-
144
-
145
-
146
-
147
-
148
-
149
-
150
-
151
-
152
-
153
-
154
-
155
-
156
-
157
-
158
-
159
-
160
-
161
-
162
 |
 |
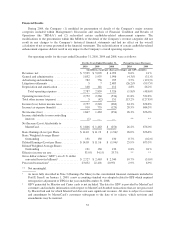
assessments growth in 2010. In 2009, the effect of pricing changes increased domestic assessments
growth by approximately 4 percentage points, of which approximately 1 percentage point was
associated with the October 2008 pricing changes which were repealed at the end of June 2009. See
Note 22 (Legal and Regulatory Proceedings) to the consolidated financial statements included in Part II,
Item 8 for more information.
• The net impact of foreign currency relating to the translation of domestic assessments from the euro and
Brazilian real to U.S. dollars unfavorably impacted revenue growth by a minimal amount in 2010 and
by approximately 2 percentage points in 2009.
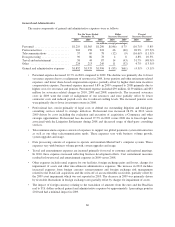
Cross-border volume fees—There was an increase in cross-border volume fees of 27.7% in 2010, as
compared to a 2.5% decrease in 2009, due to:
• Cross-border volumes increased 15.2% in 2010, when measured in local currency terms, and increased
15.1%, when measured on a U.S. dollar-converted basis. In 2009, cross-border volumes increased 0.2%,
when measured in local currency terms, and decreased 6.2%, when measured on a U.S. dollar-converted
basis.
• Pricing changes represented approximately a net 13 percentage points of cross-border revenue growth in
2010. This increase included approximately 18 percentage points related to pricing changes
implemented in October 2009, partially offset by a decrease due to the pricing structure change in
October 2010. Furthemore, the October 2008 pricing changes which were repealed at the end of June
2009 as part of our interim arrangement with the European Commission had an approximate 2
percentage point negative impact on 2010 cross-border revenue growth.
The decrease in 2009 cross-border volume fees was partially offset by approximately 7 percentage
points relating to pricing changes. During 2009, the cross-border pricing actions also included an
increase to cross-border rebates as discussed in the rebates and incentives discussion below. In addition,
approximately 1 percentage point of the 7 percentage point pricing increase was associated with certain
pricing changes implemented in October 2008 and repealed at the end of June 2009 as part of our
interim arrangement with the European Commission. See Note 22 (Legal and Regulatory Proceedings)
to the consolidated financial statements included in Part II, Item 8 for more information.
• The net impact of foreign currency relating to the translation of cross-border volume fees from the euro
and Brazilian real to U.S. dollars unfavorably impacted cross-border revenue growth by approximately 2
percentage points in both 2010 and 2009.
Transaction processing fees—The increases in transaction processing fees of 7.6% and 14.9% during 2010
and 2009, respectively, were due to:
• Pricing changes implemented in April 2009 represented approximately 3 percentage points of the
increase in 2010 and approximately 8 percentage points of the increase in 2009.
• Processed transactions increased 2.9% and 6.9% during 2010 and 2009, respectively. Our growth in
processed transactions in 2010 was lower than in 2009 due to the continuing effects of prior debit
portfolio losses in the U.S. and U.K. Those debit portfolio losses impacted revenues to a lesser extent
than the percentage decrease in the number of transactions due to the pricing of those products and
portfolios.
• Growth in revenues was partially offset by the effects of transaction processing activities for which
revenues are not driven by the number of transactions. Furthermore, the net impact of foreign currency
relating to the translation of transaction processing fees from the euro and Brazilian real to U.S. dollars
unfavorably impacted growth by approximately 1 percentage point in 2010 and by approximately 2
percentage points in 2009.
57