LensCrafters 2012 Annual Report Download - page 99
Download and view the complete annual report
Please find page 99 of the 2012 LensCrafters annual report below. You can navigate through the pages in the report by either clicking on the pages listed below, or by using the keyword search tool below to find specific information within the annual report.-
 1
1 -
2
-
3
-
4
-
5
-
6
-
7
-
8
-
9
-
10
-
11
-
12
-
13
-
14
-
15
-
16
-
17
-
18
-
19
-
20
-
21
-
22
-
23
-
24
-
25
-
26
-
27
-
28
-
29
-
30
-
31
-
32
-
33
-
34
-
35
-
36
-
37
-
38
-
39
-
40
-
41
-
42
-
43
-
44
-
45
-
46
-
47
-
48
-
49
-
50
-
51
-
52
-
53
-
54
-
55
-
56
-
57
-
58
-
59
-
60
-
61
-
62
-
63
-
64
-
65
-
66
-
67
-
68
-
69
-
70
-
71
-
72
-
73
-
74
-
75
-
76
-
77
-
78
-
79
-
80
-
81
-
82
-
83
-
84
-
85
-
86
-
87
-
88
-
 89
89 -
 90
90 -
 91
91 -
 92
92 -
 93
93 -
 94
94 -
 95
95 -
 96
96 -
 97
97 -
 98
98 -
 99
99 -
 100
100 -
 101
101 -
 102
102 -
 103
103 -
 104
104 -
 105
105 -
 106
106 -
 107
107 -
 108
108 -
 109
109 -
110
-
111
-
112
-
113
-
114
-
115
-
116
-
117
-
118
-
119
-
120
-
121
-
122
-
123
-
124
-
125
-
126
-
127
-
128
-
129
-
130
-
131
-
132
-
133
-
134
-
135
-
136
-
137
-
138
-
139
-
140
-
141
-
142
-
143
-
144
-
145
-
146
-
147
-
148
-
149
-
150
-
151
-
152
-
153
-
154
-
155
-
156
-
157
-
158
-
159
-
160
-
161
-
162
-
163
-
164
-
165
-
166
-
167
-
168
-
169
-
170
-
171
-
172
-
173
-
174
-
175
-
176
-
177
-
178
-
179
-
180
-
181
-
182
-
183
-
184
-
185
-
186
-
187
-
188
-
189
-
190
-
191
-
192
-
193
-
194
-
195
-
196
-
197
-
198
-
199
-
200
-
201
-
202
-
203
-
204
-
205
-
206
-
207
-
208
-
209
-
210
-
211
-
212
-
213
-
214
-
215
-
216
-
217
-
218
-
219
-
220
-
221
-
222
-
223
-
224
-
225
-
226
-
227
-
228
-
229
-
230
-
231
-
232
-
233
-
234
-
235
-
236
-
237
-
238
-
239
-
240
-
241
-
242
-
243
-
244
-
245
-
246
-
247
-
248
-
249
-
250
-
251
-
252
-
253
-
254
-
255
-
256
-
257
-
258
-
259
-
260
-
261
-
262
-
263
-
264
-
265
-
266
-
267
-
268
-
269
-
270
-
271
-
272
-
273
-
274
-
275
-
276
-
277
-
278
-
279
 |
 |

| 13 >MANAGEMENT REPORT
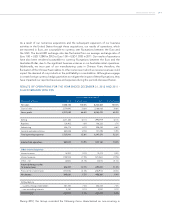
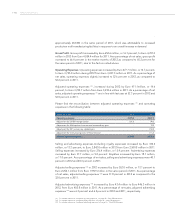
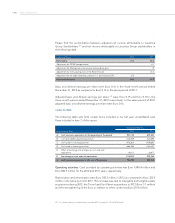
Please find the reconciliation between adjusted selling and advertising expenses(12)/(13) and
selling and advertising expenses in the following table:
(millions of Euro) 2012 2011
Selling and advertising expenses 2,842.0 2,509.8
Adjustment for OPSM reorganization (17.3) -
Adjustment for 50th anniversary celebrations - (5.7)
Adjustment for restructuring costs in Retail Division - (2.9)
Adjusted selling and advertising expenses 2,824.6 2,501.2
General and administrative expenses, including intangible asset amortization increased by
Euro145,5 million, or 19.7 percent, to Euro883.0 million in 2012 from Euro737.5 million in
the same period of 2011. As a percentage of net sales, general and administrative expenses
were 12.5 percent in 2012 as compared to 11.9 percent in the same period of 2011.
Adjusted general and administrative expenses (14) increased by Euro147.7 million, or 20.2
percent, to Euro880.0 million in 2012 as compared to Euro732.3 million in the same period
of 2011. As a percentage of net sales, adjusted general and administrative expenses were
12.4 percent in 2012 as compared to 11.8 percent in the same period of 2011.
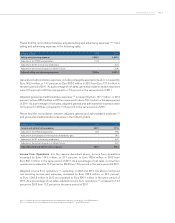
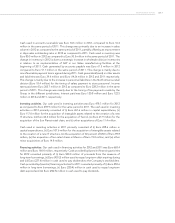
Please find the reconciliation between adjusted general and administrative expenses(14)
and general and administrative expenses in the following table:
(millions of Euro) 2012 2011
General and administrative expenses 883.0 737.5
Adjustment for OPSM reorganization (3.0) (9.6)
Adjustment for Multiopticas Internacional extraordinary gain - 19.0
Adjustment for 50th anniversary celebrations - (6.3)
Adjustment for restructuring costs in Retail Division - (8.3)
Adjusted general and administrative expenses 880.0 732.3
Income from Operations. For the reasons described above, income from operations
increased by Euro 174.9 million, or 21.7 percent, to Euro 982.0 million in 2012 from
Euro807.1 million in the same period of 2011. As a percentage of net sales, income from
operations increased to 13.9 percent in 2012 from 13.0 percent in the same period of 2011.
Adjusted income from operations (15), excluding, in 2012 and 2011, the above mentioned
non-recurring income and expenses, increased by Euro 182.9 million, or 22.3 percent,
to Euro1,003.8 million in 2012 as compared to Euro820.9 million in the same period of
2011. As a percentage of net sales, adjusted income from operations(15) increased to 14.2
percent in 2012 from 13.2 percent in the same period of 2011.
(14) For a further discussion of adjusted general and administrative expenses, see page 43 - “Non-IFRS Measures”.
(15) For a further discussion of adjusted income from operations, see page 43 - “Non-IFRS Measures”.