LensCrafters 2012 Annual Report Download - page 131
Download and view the complete annual report
Please find page 131 of the 2012 LensCrafters annual report below. You can navigate through the pages in the report by either clicking on the pages listed below, or by using the keyword search tool below to find specific information within the annual report.-
 1
1 -
2
-
3
-
4
-
5
-
6
-
7
-
8
-
9
-
10
-
11
-
12
-
13
-
14
-
15
-
16
-
17
-
18
-
19
-
20
-
21
-
22
-
23
-
24
-
25
-
26
-
27
-
28
-
29
-
30
-
31
-
32
-
33
-
34
-
35
-
36
-
37
-
38
-
39
-
40
-
41
-
42
-
43
-
44
-
45
-
46
-
47
-
48
-
49
-
50
-
51
-
52
-
53
-
54
-
55
-
56
-
57
-
58
-
59
-
60
-
61
-
62
-
63
-
64
-
65
-
66
-
67
-
68
-
69
-
70
-
71
-
72
-
73
-
74
-
75
-
76
-
77
-
78
-
79
-
80
-
81
-
82
-
83
-
84
-
85
-
86
-
87
-
88
-
89
-
90
-
91
-
92
-
93
-
94
-
95
-
96
-
97
-
98
-
99
-
100
-
101
-
102
-
103
-
104
-
105
-
106
-
107
-
108
-
109
-
110
-
111
-
112
-
113
-
114
-
115
-
116
-
117
-
118
-
119
-
120
-
 121
121 -
 122
122 -
 123
123 -
 124
124 -
 125
125 -
 126
126 -
 127
127 -
 128
128 -
 129
129 -
 130
130 -
 131
131 -
 132
132 -
 133
133 -
 134
134 -
 135
135 -
 136
136 -
 137
137 -
 138
138 -
 139
139 -
 140
140 -
 141
141 -
142
-
143
-
144
-
145
-
146
-
147
-
148
-
149
-
150
-
151
-
152
-
153
-
154
-
155
-
156
-
157
-
158
-
159
-
160
-
161
-
162
-
163
-
164
-
165
-
166
-
167
-
168
-
169
-
170
-
171
-
172
-
173
-
174
-
175
-
176
-
177
-
178
-
179
-
180
-
181
-
182
-
183
-
184
-
185
-
186
-
187
-
188
-
189
-
190
-
191
-
192
-
193
-
194
-
195
-
196
-
197
-
198
-
199
-
200
-
201
-
202
-
203
-
204
-
205
-
206
-
207
-
208
-
209
-
210
-
211
-
212
-
213
-
214
-
215
-
216
-
217
-
218
-
219
-
220
-
221
-
222
-
223
-
224
-
225
-
226
-
227
-
228
-
229
-
230
-
231
-
232
-
233
-
234
-
235
-
236
-
237
-
238
-
239
-
240
-
241
-
242
-
243
-
244
-
245
-
246
-
247
-
248
-
249
-
250
-
251
-
252
-
253
-
254
-
255
-
256
-
257
-
258
-
259
-
260
-
261
-
262
-
263
-
264
-
265
-
266
-
267
-
268
-
269
-
270
-
271
-
272
-
273
-
274
-
275
-
276
-
277
-
278
-
279
 |
 |
| 45 >MANAGEMENT REPORT - APPENDIX
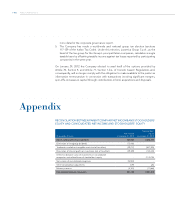
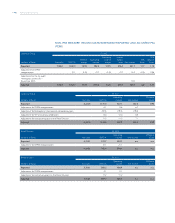
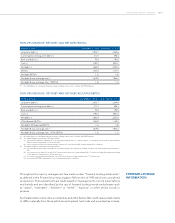
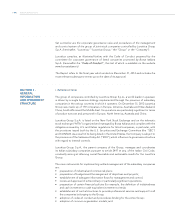
Luxottica Group 4Q 2012
(millions of Euro) Net sales EBITDA
EBITDA
margin
Operating
Income
Operating
Income
margin
Income
before
taxes
Net
income
EPS
base
EPS
dilutive
(Euro)
Reported 1,632.3 258.4 15.8% 164.0 10.0% 133.3 76.8 0.16 0.16
Adjustment for the tax audit
relating to Luxottica S.r.l.
(Fiscal Year 2007) 10.0 0.03
Adjusted 1,632.3 258.4 19.2% 164.0 10.0% 133.3 86.8 0.19 0.18
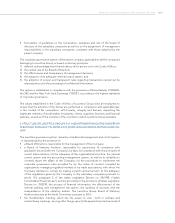
Luxottica Group 4Q 2011
(millions of Euro) Net sales EBITDA
Operating
income Net income
EPS base
(Euro)
Reported 1,509.0 222.8 128.4 64.4 0.14
Adjustment for OPSM reorganization - 0.7 9.6 6.7 -
Adjustment for Multiopticas Internacional extraordinary gain - 1.9 1.9 1.9 -
Adjustment for restructuring costs in the Retail Division - (0.7) (0.7) (0.3) -
Adjusted 1,509.0 224.7 139.3 72.7 0.16
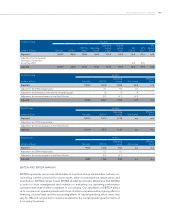
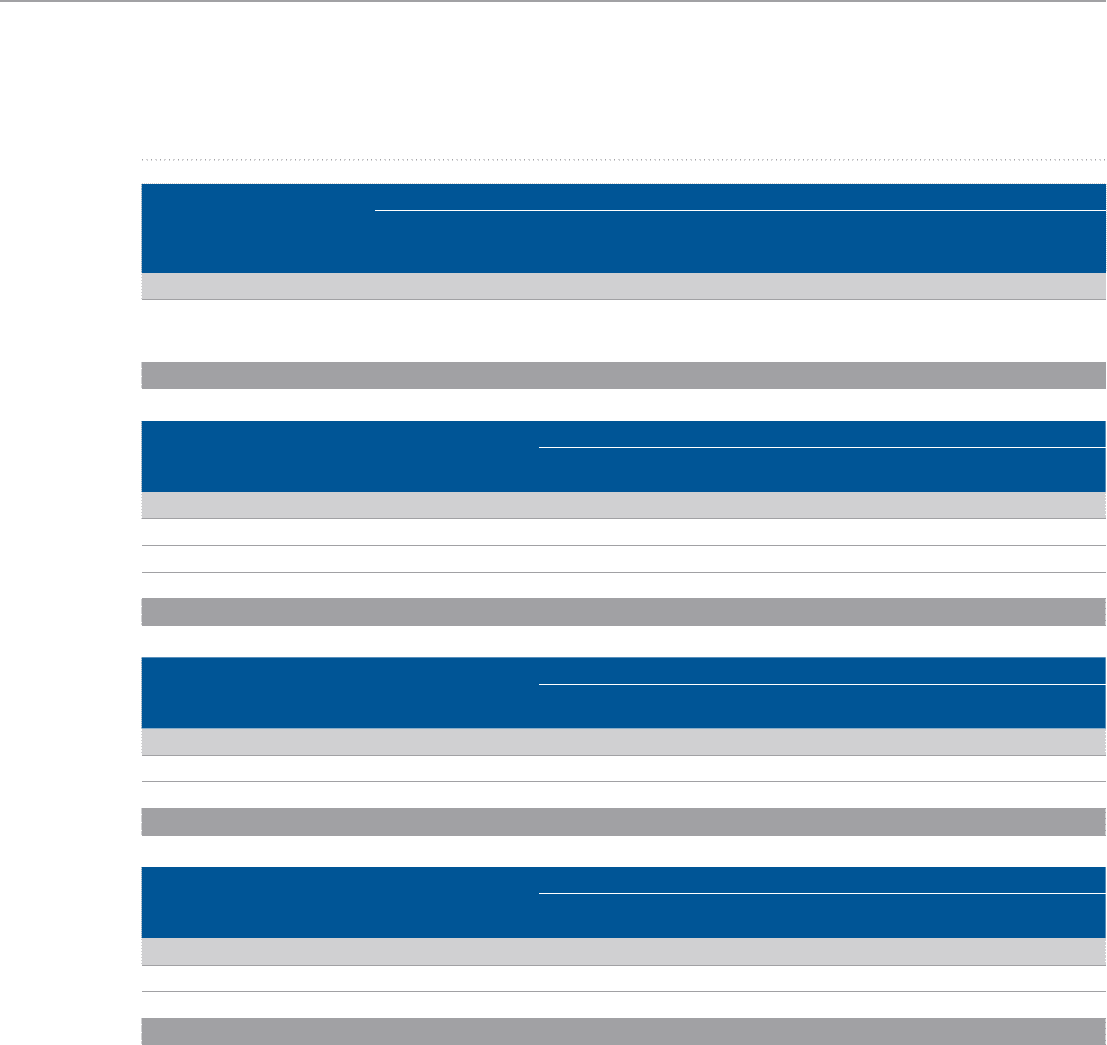
Retail Division 4Q 2012
(milioni di Euro) Net sales EBITDA
Operating
income Net income
EPS base
(Euro)
Reported 1,021.0 157.3 113.9 n.a. n.a.
Adjustment for OPSM reorganization
Adjustment for restructuring costs in the Retail Division
Adjusted 1,021.0 157.3 113.9 n.a. n.a.
Retail Division 4Q 2011
(millions of Euro) Net sales EBITDA
Operating
income Net income
EPS base
(Euro)
Reported 952.9 135.8 94.7 n.a. n.a.
Adjustment for OPSM reorganization 0.7 0.7
Adjustment for restructuring costs in the Retail Division (0.7) (0.7)
Adjusted 952.9 135.8 94.8 n.a. n.a.
EBITDA AND EBITDA MARGIN
EBITDA represents net income attributable to Luxottica Group stockholders, before non-
controlling interest, provision for income taxes, other income/expense, depreciation and
amortization. EBITDA margin means EBITDA divided by net sales. We believe that EBITDA
is useful to both management and investors in evaluating our operating performance
compared with that of other companies in our industry. Our calculation of EBITDA allows
us to compare our operating results with those of other companies without giving effect to
financing, income taxes and the accounting effects of capital spending, which items may
vary for different companies for reasons unrelated to the overall operating performance of
a company’s business.