LensCrafters 2012 Annual Report Download - page 219
Download and view the complete annual report
Please find page 219 of the 2012 LensCrafters annual report below. You can navigate through the pages in the report by either clicking on the pages listed below, or by using the keyword search tool below to find specific information within the annual report.-
 1
1 -
2
-
3
-
4
-
5
-
6
-
7
-
8
-
9
-
10
-
11
-
12
-
13
-
14
-
15
-
16
-
17
-
18
-
19
-
20
-
21
-
22
-
23
-
24
-
25
-
26
-
27
-
28
-
29
-
30
-
31
-
32
-
33
-
34
-
35
-
36
-
37
-
38
-
39
-
40
-
41
-
42
-
43
-
44
-
45
-
46
-
47
-
48
-
49
-
50
-
51
-
52
-
53
-
54
-
55
-
56
-
57
-
58
-
59
-
60
-
61
-
62
-
63
-
64
-
65
-
66
-
67
-
68
-
69
-
70
-
71
-
72
-
73
-
74
-
75
-
76
-
77
-
78
-
79
-
80
-
81
-
82
-
83
-
84
-
85
-
86
-
87
-
88
-
89
-
90
-
91
-
92
-
93
-
94
-
95
-
96
-
97
-
98
-
99
-
100
-
101
-
102
-
103
-
104
-
105
-
106
-
107
-
108
-
109
-
110
-
111
-
112
-
113
-
114
-
115
-
116
-
117
-
118
-
119
-
120
-
121
-
122
-
123
-
124
-
125
-
126
-
127
-
128
-
129
-
130
-
131
-
132
-
133
-
134
-
135
-
136
-
137
-
138
-
139
-
140
-
141
-
142
-
143
-
144
-
145
-
146
-
147
-
148
-
149
-
150
-
151
-
152
-
153
-
154
-
155
-
156
-
157
-
158
-
159
-
160
-
161
-
162
-
163
-
164
-
165
-
166
-
167
-
168
-
169
-
170
-
171
-
172
-
173
-
174
-
175
-
176
-
177
-
178
-
179
-
180
-
181
-
182
-
183
-
184
-
185
-
186
-
187
-
188
-
189
-
190
-
191
-
192
-
193
-
194
-
195
-
196
-
197
-
198
-
199
-
200
-
201
-
202
-
203
-
204
-
205
-
206
-
207
-
208
-
 209
209 -
 210
210 -
 211
211 -
 212
212 -
 213
213 -
 214
214 -
 215
215 -
 216
216 -
 217
217 -
 218
218 -
 219
219 -
 220
220 -
 221
221 -
 222
222 -
 223
223 -
 224
224 -
 225
225 -
 226
226 -
 227
227 -
 228
228 -
 229
229 -
230
-
231
-
232
-
233
-
234
-
235
-
236
-
237
-
238
-
239
-
240
-
241
-
242
-
243
-
244
-
245
-
246
-
247
-
248
-
249
-
250
-
251
-
252
-
253
-
254
-
255
-
256
-
257
-
258
-
259
-
260
-
261
-
262
-
263
-
264
-
265
-
266
-
267
-
268
-
269
-
270
-
271
-
272
-
273
-
274
-
275
-
276
-
277
-
278
-
279
 |
 |

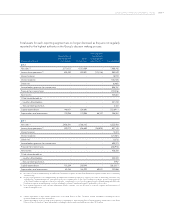
| 133 >CONSOLIDATED FINANCIAL STATEMENTS - NOTES
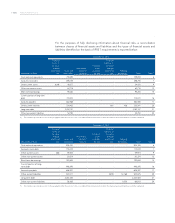
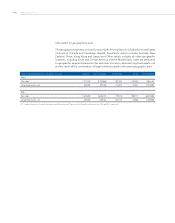
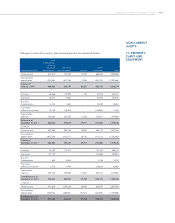
Total assets for each reporting segment are no longer disclosed as they are not regularly
reported to the highest authority in the Group’s decision making process. (1) (2)
(thousands of Euro)
Manufacturing
and Wholesale
Distribution
Retail
Distribution
Inter segment
transactions
and corporate
adjustments (c) Consolidated
2012
Net sales (a) 2,773,073 4,313,069 - 7,086,142
Income from operations (b) 604,494 552,691 (175,136) 982,049
Interest income - - - 18,910
Interest expense (138,140)
Other-net - - - (6,463)
Income before provision for income taxes - - - 856,357
Provision for income taxes - - - (310,476)
Net income - - - 545,881
Of which attributable to:
- Luxottica Stockholders - - - 541,700
- Non-controlling interests - - - 4,181
Capital expenditures 148,001 224,890 - 372,891 (1)
Depreciation and amortization 100,956 170,988 86,337 358,281
2011
Net sales (a) 2,456,341 3,766,142 - 6,222,483
Income from operations (b) 529,073 436,869 (158,802) 807,140
Interest income - - - 12,472
Interest expense (121,067)
Other-net - - - (3,273)
Income before provision for income taxes - - - 695,273
Provision for income taxes - - - (236,972)
Net income - - - 458,300
Of which attributable to:
- Luxottica Stockholders - - - 452,343
- Non-controlling interests - - - 5,957
Capital expenditures 153,229 205,094 - 358,323 (2)
Depreciation and amortization 85,765 148,292 89,831 323,888
(a) Net sales of both the Manufacturing and Wholesale Distribution segment and the Retail Distribution segment include sales to third party
customers only.
(b) Income from operations of the Manufacturing and Wholesale Distribution segment is related to net sales to third party customers only,
excluding the “manufacturing prot” generated on the inter company sales to the Retail Distribution segment. Income from operations
of the Retail Distribution segment is related to retail sales, considering the cost of goods acquired from the Manufacturing and Wholesale
Distribution segment at manufacturing cost, thus including the relevant “manufacturing prot” attributable to those sales.
(c) Inter segment transactions and corporate adjustments include corporate costs not allocated to a specic segment and amortization of
acquired intangible assets.
(1) Capital expenditures in 2012 include capital leases of the Retail Division of Euro 7.9 million. Capital expenditures excluding the above
mentioned additions were Euro365.0 million.
(2) Capital expenditures in 2011 include (i) the acquisition of a building for approximately Euro25.0 million and (ii) capital leases of the Retail
Division of Euro25.6 million. Capital expenditures excluding the above mentioned additions were Euro307.5 million.